


Contents
Scroll to:
https://doi.org/10.23947/2541-9129-2025-9-1-32-41
EDN: GZMIUV
Scroll to:
Introduction. In the near future, the issue of selecting appropriate methods to assess the effectiveness of fish protection devices (FPDs) will continue to be relevant. Previously, the necessary data could only be obtained by ichthyological studies, which involved using specific techniques and equipment. However, the introduction of a new edition of the Code of Rules SP 101.13330.2023 changed the situation and opened up the possibility of using sonar tools to determine the FPDs effectiveness. While there is a lack of public information regarding the specifics and potential of this approach, it is possible that underwater video surveillance may yield similar results to ichthyological (hydroacoustic) methods. This study aims to verify this hypothesis.
Materials and Methods. During ichthyological studies at the Zainskaya power plant, fish were captured using nets with mesh sizes of 10, 18, 20, 22, 30, and 70 mm. A Molchanov GR-18 bathometer was used to take phytoplankton samples. Zooplankton samples were collected by the Apstein network. Zoobenthos samples were collected using an automatic DAK-250 dredger. Underwater video surveillance was conducted using a Praktik Murena camera with a resolution of 720 HD (1280´720 pixels), which is equipped with built-in infrared illumination and displays information on a surface monitor. The camera has a wide-angle lens with a 130° viewing angle.
Results. A notable advantage of the proposed method, identified in the course of scientific research, concerned the sample size. With video surveillance, it turned out to be 2.25 times larger than with the traditional method. This was because video cameras captured more individuals than the number of fish caught in a net. A larger sample size provided a more statistically significant result. As the amount of data increased, the accuracy of the characteristics of the general population increased, and random error decreased. To determine the FPD efficiency coefficient (EC), the concentration of fish before and after the FPDs, as well as the survival rate of individuals after contact with the FPDs were taken into account. When using the traditional method in 2023, the average EC of the FPDs efficiency at on-shore pumping station No. 3 was 86.9%. Under the same conditions, the new approach proposed by the authors showed a similar average efficiency of 87.3%, with a difference of only 0.46%, which was completely insignificant. The maximum discrepancy was in the spring of 2023, where the indicator of the alternative method was 9.3% higher than the traditional one, while the minimum was noted in autumn at 0.1%.
Discussion and Conclusion. So, it was possible to confirm the hypothesis that the underwater video surveillance method is comparable in results with the ichthyological (hydroacoustic) method. However, the new approach is not yet legally recognized and can only be used as an additional tool. Firstly, video surveillance can help to determine whether ichthyological studies are necessary. Secondly, water intake operators can use the experimental method in between ichthyological surveys to obtain operational data on the effectiveness of FPDs.
Saetov A.R., Kalaida M.L. Use of Underwater Video Surveillance to Monitor a Fish Protection Device at a Thermal Power Plant Water Intake Facility. Safety of Technogenic and Natural Systems. 2025;9(1):32-41. https://doi.org/10.23947/2541-9129-2025-9-1-32-41. EDN: GZMIUV
Introduction. The equipment of thermal power plants requires cooling. For this purpose, water is used. Water is taken from natural and artificial reservoirs by hydraulic structures called water intakes [1]. Two essential operating conditions for these facilities are an uninterrupted supply of water and the presence of a fish protection device (FPD) that prevents fish from entering the equipment [2].
The minimum regulatory FPD efficiency is 70% [3]. Modern FPD designs meet this requirement1.
The Zainskaya State Regional Power Plant (GRES) water supply system is reversible. The waste water is cooled in the Zainsk reservoir. Three on-shore pumping stations (SPS) supply circulating industrial water. The Zainsk reservoir is a fishing reservoir. Taking into account this circumstance and natural factors, FPDs of WAC (water-air curtain) type were installed on all three SPSs from 2015 to 2018. It should protect the young fish from water intake, and the intake from floating and submerged debris. Industrial and energy water intakes at Iriklinskaya, Kaliningradskaya and Reftinskaya regional power stations were equipped with the same FPDs. The devices have shown high fish protection efficiency [4].
The ascending water-air curtain is formed by a stream of water, which is pumped to the system of bottom modules of an FPD. Air is also supplied there via a parallel pipeline. Passing through the aerating nozzles, it is directed into a perforated pipeline, mixes with water, rises to the surface and thus forms an obstacle for fish and debris (Fig. 1).
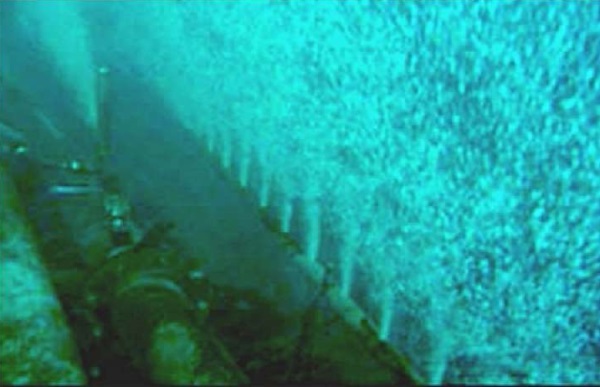
Fig. 1. WAC-type FPD in action
For a WAC-type FPD, a perforated pipeline is laid along the bottom in front of the water intake zone. An air-water mixture is constantly supplied from its openings. Fish consider a "wall" of air bubbles as a physical barrier. In addition, they are deterred by the sonar noise of air currents. At the same time, the fish are not injured. The WAC-type FPD consists of interchangeable modules of the same type. Therefore, it is easier to maintain it than other protective devices. In winter, the air curtain forms an ice-hole. Due to the constant mixing of water, it does not freeze, and the water intake is not clogged with ice.
The use of WAC-type FPD to protect baby fish is based, in particular, on fright. This is how fish react to a wall of upward-moving air bubbles and swim away from it. The high efficiency of the method can be explained by its complex effect on babies. Firstly, for the visual receptors of fish, the water-air curtain is an external stimulus. Secondly, it is perceived as a mechanical barrier (wall). Thirdly, the curtain makes noise. Air bubbles rise from the holes of the perforated pipes. When surfacing, they expand and collapse with a hydrocavitation effect. A micro-explosion occurs, which scares the fish away.
In comparison with an air-bubble curtain, the energy of an air-water curtain is much higher, as it is created not only by air but also by a denser flow of water. In a water-air curtain, fish are able to rise more efficiently to the upper layers and are carried out by the flow from the intake [5]. As a rule, an air curtain is used at large water intakes for energy purposes.
Materials and Methods. Ichthyological studies were conducted to assess the FPD effectiveness of the Zainskaya GRES water intake facilities2. The quantitative and qualitative composition of fish caught in the nets in the supply channel were analyzed. Special studies were conducted to calculate the survival rate. A control group of fish was caught before the FPD, and an experimental group was caught in the supply channel after contact with the FPD elements. In both groups, the number of dead and live individuals was calculated. The survivors were observed during the 24 hours [6]. Then the number of dead and survivors was calculated again and thus the survival rate was obtained.
The FPD efficiency coefficient was expressed as a percentage and was calculated by dividing the number of fish that are trapped by the FPD by the total number of fish that enter the intake structure when the FPD was not present. Records were kept continuously throughout the year to ensure accuracy.
An observation post for ichthyological sampling using standard methods was set up at SPS No. 3, equipped with a FPD [7]. The fish species were determined through taxonomic revisions and summaries [8].
Seasonal dynamics of fish entering the water intake facilities of SPS No. 3 at Zainskaya GRES is observed. Before and after the FPD, the highest number of fish was caught in summer, with the lowest numbers in autumn, winter, and early spring (Table 1). This can be explained by the fact that colder water reduces the activity of fish.
Table 1
Quantitative Composition and Species of Fish Recorded in the Water Intake Facilities of SPS No. 3 at Zainskaya GRES Before and After the FPD in 2023, Number.
|
Types of fish |
Winter |
Spring |
Summer |
Autumn |
||||
|
Before FPD |
After FPD |
Before FPD |
After FPD |
Before FPD |
After FPD |
Before FPD |
After FPD |
|
|
Bream |
– |
– |
– |
– |
5 |
– |
– |
– |
|
Alburn |
45 |
– |
1 |
1 |
6 |
1 |
– |
2 |
|
White bream |
6 |
– |
7 |
1 |
– |
– |
– |
4 |
|
Chub |
– |
– |
2 |
– |
– |
– |
– |
– |
|
Roach |
– |
– |
2 |
1 |
56 |
1 |
2 |
4 |
|
Catfish |
– |
– |
– |
– |
1 |
– |
– |
– |
|
Perch |
21 |
2 |
36 |
6 |
250 |
115 |
152 |
6 |
|
Total |
72 |
2 |
48 |
9 |
318 |
117 |
154 |
16 |
According to round-the-clock observations at SPS No. 3, the highest number of fish got into nets and equipment at dusk and at night (in 21:00, 1:00, 5:00 and 9:00). At this time, the fish saw the obstacles worse, and they were captured by the current near the FPD. First of all, this applied to babies. It was harder for them to resist the flow.
The motion activity of carp fish decreased from 20:00 to 6:00. This was revealed by spectral analysis, which took 34 hours.
Underwater video surveillance was also conducted together with the ichthyological research. A Praktik Murena camera was installed before and after the FPD [9]. It took photos and videos. This equipment output information to the surface monitor and stored the data. The resolution of 1280´720 pixels provided a clear image even in low light conditions. In addition, it was possible to turn on the LED or infrared backlight. They were remotely adjustable, and this was important when working in muddy water or in bad weather. Special sensors measured the water depth and temperature. The optional compass function displayed the camera's direction; it showed which way it was turned.
Due to the powerful built-in lithium-ion battery (10,000 mAh), the camera could work for 6 hours even in cold weather, while the battery indicator showed the battery life.
Figure 2 shows the above-water block. This is a portable five-inch color TFT (thin-film transistor) monitor.
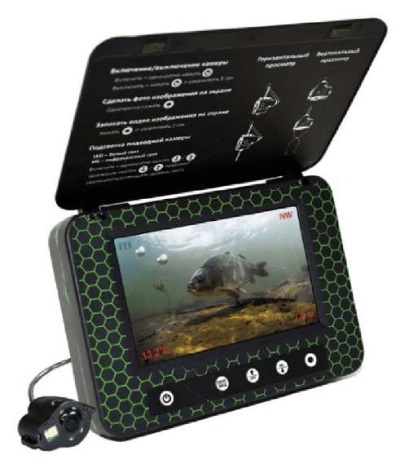
Fig. 2. Underwater Praktik Murena video camera
The high resolution 720 HD (1,280´720 pixels) provided a clear and detailed image even at a depth of 10–15 meters in conditions of average water clarity. A special visor protected the screen from sunlight, and it was possible to install a microSD card with a capacity up to 128 GB. The wide viewing angle was 130 degrees, and powerful illumination from two white LEDs and four infrared LEDs allowed exploration of the underwater world both day and night, even in low-visibility conditions. The video camera had an IP 68 protection rating, making it waterproof and resistant to wear. The waterproof video cable, with a length of 15 meters and a maximum load capacity of 15 kg, could withstand extreme temperatures from –20°C to +60°C.
The complex combined elements with three main functions: a video camera, a power source and an information storage device. Two additions were made to the original design. Firstly, an aluminum case was purchased to carry, store, and protect the device from precipitation (Fig. 3). The case was insulated to extend the battery life during cold seasons. Second, an additional 2 terabyte external hard drive was added to store all footage.
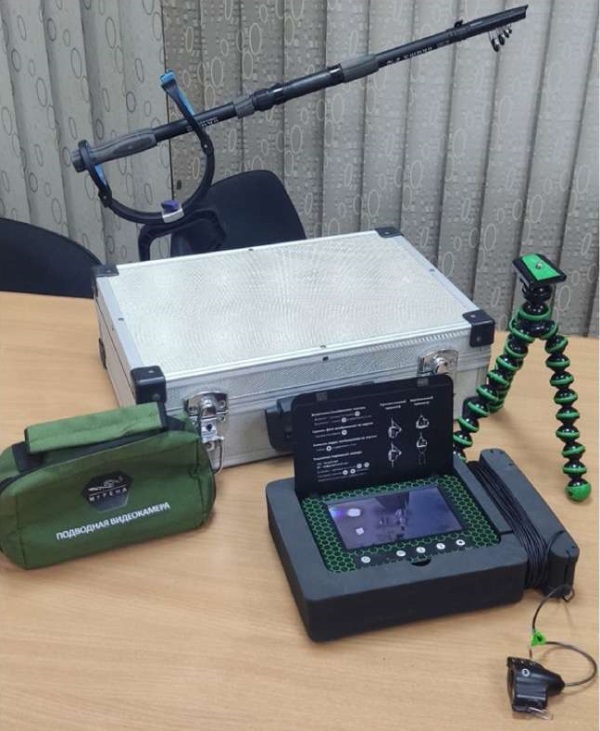
Fig. 3. The case and the surface unit of the Praktik Murena video camera
A special conductor has been developed for installing and fixing the camera underwater (Fig. 4).
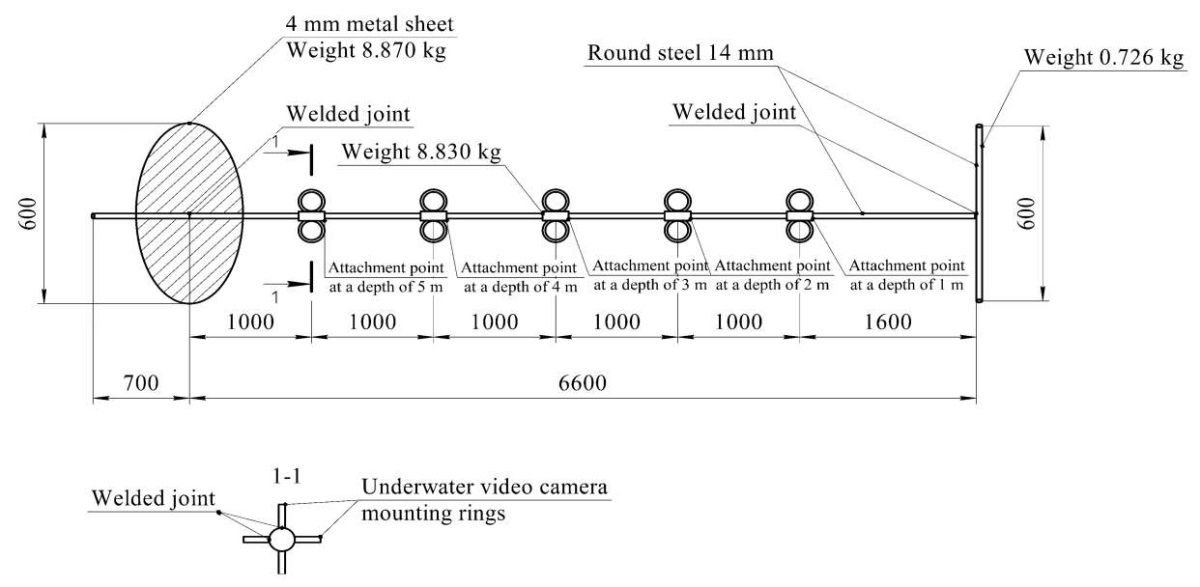
Fig. 4. A conductor for underwater video surveillance
The conductor was made of a steel round bar with a diameter of 14 mm and a length of 7,300 mm. In the upper part, there was a transverse crossbar with a diameter of 14 mm and a length of 600 mm, welded to the main part. The crossbar acted as a handle when the lower end of the conductor was immersed in the bottom soil and when it was rotated to orient the video camera in the desired direction. At a distance of 600 mm from the lower end of the conductor, a round metal sheet with a thickness of 4 mm was fixed with a welded joint. It restricted the penetration of the conductor into the ground and fixed it in an upright position. To attach the underwater camera, metal rings were welded every 90° around the circumference of the metal sheet. The distance between them was 1,000 mm. The total weight of the conductor structure did not exceed 19 kg, so even one researcher could work with it.
Results. The survey before and after the FPD at the SPS No. 3 of the Zainskaya GRES revealed the stability of fish species composition. It did not depend on the season and generally corresponded to the data of ichthyological studies. During the study, 1,654 individuals were recorded. 256 individuals (15.48% of the total number) could not be identified [10]. Therefore, for the sake of objectivity, Figure 5 shows the quantitative composition, and Table 2 contains all the data obtained [11].
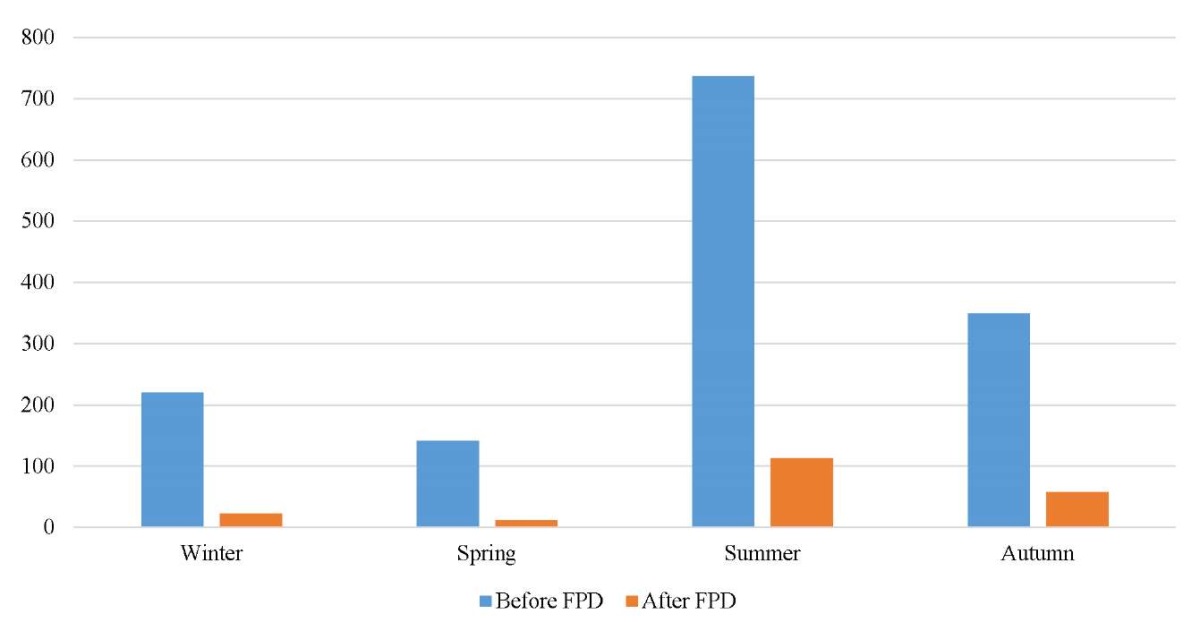
Fig. 5. Number of fish caught by the underwater surveillance camera before and after the FPD at SPS No. 3 in 2023, individuals
Table 2
Number and Types of Fish Recorded by Underwater Surveillance Cameras Before and After the FPD at SPS No. 3 During Different Seasons of 2023, Individuals
|
Types of fish |
Winter |
Spring |
Summer |
Autumn |
||||
|
Before FPD |
After FPD |
Before FPD |
After FPD |
Before FPD |
After FPD |
Before FPD |
After FPD |
|
|
Alburn |
89 |
3 |
63 |
2 |
271 |
15 |
131 |
7 |
|
White bream, bream * |
18 |
1 |
12 |
– |
71 |
8 |
35 |
5 |
|
Perch |
42 |
6 |
24 |
2 |
143 |
25 |
72 |
15 |
|
Chub |
22 |
3 |
12 |
3 |
78 |
16 |
35 |
8 |
|
Roach |
20 |
5 |
14 |
2 |
69 |
14 |
32 |
5 |
|
Not determined |
29 |
5 |
16 |
3 |
105 |
35 |
45 |
18 |
|
Total |
220 |
23 |
141 |
12 |
737 |
113 |
350 |
58 |
|
*White bream and bream come together because they can be difficult to distinguish on the screen. |
||||||||
Table 3 provides the total number of fish recorded in the FPD area by two methods. According to these data, fish were especially active in autumn. Relatively high activity was observed in summer, low — in winter and spring.
Table 3
The Total Number of Fish Recorded in the FPD Area of the Zainskaya GRES During the Period of Research by the Ichthyological (Ich.) Method and the Method of Underwater Video Surveillance (Exp.) in 2023
|
Season and fixation method |
Winter |
Spring |
Summer |
Autumn |
Total for a year |
|||||
|
Ich. |
Exp. |
Ich. |
Exp. |
Ich. |
Exp. |
Ich. |
Exp. |
Ich. |
Exp. |
|
|
Number |
74 |
243 |
57 |
153 |
170 |
408 |
435 |
850 |
736 |
1654 |
In comparison with the ichthyological observations, the underwater observations recorded 2.25 times more individuals. The larger the sample size, the more likely it was to detect a statistically significant effect. Additionally, a larger amount of data improved the accuracy of estimating parameters for the general population and reduced random error. This was an advantage of the alternative research method.
According to the results of round-the-clock observations, regardless of the season, underwater cameras recorded fish more frequently during daylight hours (Table 4).
Table 4
The Number of Fish Recorded by Underwater Video Surveillance Cameras in 2023 at SPS No. 3 of Zainskaya GRES, Individuals/%
|
Time |
0:00– 4:00 |
4:00– 8:00 |
8:00– 12:00 |
12:00– 16:00 |
16:00– 20:00 |
20:00– 0:00 |
Per season |
|
Winter |
4/ 1.65 |
78/ 32.10 |
53/ 21.81 |
36/ 14.81 |
42/ 17.28 |
30/ 12.35 |
243/ 100 |
|
Spring |
2/ 1.31 |
51/ 33.33 |
33/ 21.57 |
15/ 9.8 |
33/ 21.57 |
19/ 12.42 |
153/ 100 |
|
Summer |
13/ 1.53 |
337/ 39.65 |
185/ 21.76 |
104/ 12.24 |
155/ 18.23 |
56/ 6.59 |
850/ 100 |
|
Autumn |
4/ 0.98 |
162/ 39.71 |
93/ 22.79 |
39/ 9.56 |
77/ 18.87 |
33/ 8.09 |
408/ 100 |
|
Total for a year |
23/ 1.39* |
628/ 37.97* |
364/ 22.01* |
194/ 11.73 |
307/ 18.56* |
138/ 8.34* |
1654/ 100 |
|
*The indicator is calculated not by the time of day, but by the results of the year. This is a fraction of the total annual number of 1,654. |
|||||||
Underwater video surveillance revealed the smallest number of fish at dusk and at night, from 22:00 to 4:00. This was due to the biorhythmicity of most fish. Their motor activity decreased from 20:00 to 6:00 [11]. From 0:00 to 4:00, the underwater surveillance camera recorded only 23 out of 1,654 individuals, or 1.39%. This indicator remained low (from 0.98% to 1.65%) regardless of the season.
From 20:00 to 0:00, a video survey found 138 out of 1,654 individuals, or 8.34%. Particularly low rates were recorded in summer (6.59%) and autumn (8.09%).
From 12:00 to 16:00, 194 out of 1,654 individuals were captured, or 11.37%. Lows were recorded in spring (9.80%) and autumn (9.56%).
For ichthyological studies, the FPD efficiency coefficient (Кэф) was calculated using the formula:
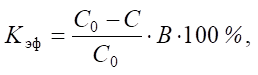
where С — fish concentration after the FPD, С0 — fish concentration before the FPD, В — survival rate of fish after contact with the FPD structural elements.
Kэф (in %) of the FPD based on the ichthyological research results in 2023:
In 2023, the average coefficient of fish protection efficiency of the FPD at SPS No. 3 was 86.9% (according to standards — at least 70%).
Together with the ichthyological research, the experiments on fish fixation using an underwater camera were conducted at SPS No. 3. They were also monitored before and after the FPD. FPD Кэф based on video surveillance results in 2023:
Average FPD Кэф in this case — 87.3%.
Table 5 compares the indicators of the FPD fish protection efficiency obtained by different methods.
Table 5
Comparison of the Effectiveness of Ichthyological and Alternative (Experimental) Methods for Determining Fish Protection Effectiveness of FPD at SPS No. 3 in 2023, %
|
Season |
FPD Кэф (ichthyological method) |
FPD Кэф (experimental method) |
Difference (– lower, + higher) |
|
Winter |
97.2 |
89.6 |
–7.8 |
|
Spring |
83.7 |
91.5 |
+9.3 |
|
Summer |
83.4 |
84.7 |
+1.6 |
|
Autumn |
83.3 |
83.4 |
+0.1 |
|
2023 |
86.9 |
87.3 |
+0.46 |
As it can be seen, the peak difference in efficiency was less than 10%, the minimum was 0.1%, and the average was 0.46%.
Discussion and Conclusion. Underwater video surveillance at a WAC-type FPD at SPS No. 3 of Zainskaya GRES has confirmed the data of traditional ichthyological studies. According to the results, these two methods show slight differences, with an average difference of less than 1% (0.46% to be more precise). This confirms the accuracy of the results and supports the hypothesis that the underwater video surveillance method is informative and promising.
To be more specific, the experimental method has not yet been legally recognized, and therefore it cannot be used as a standalone and sufficient approach. Nevertheless, it would be useful to first determine whether ichthyological research is necessary. Secondly, underwater video surveillance could be used together with traditional studies to obtain additional information on the FPD effectiveness.
Thus, the proposed method provides the water intake operator with the opportunity to quickly monitor the FPD efficiency. This monitoring can be done much more frequently than professional ichthyological (hydroacoustic) monitoring.
Underwater video surveillance is also well-suited for remote detection of fish parameters, such as length. This method allows for the monitoring of fish without the need to remove them from the water or cause any harm to them [12].
Another advantage of the new method compared to the traditional one is the larger sample size. Within the context of the presented scientific study, a difference of 2.25 times was noted in favor of underwater video surveillance. Increasing the sample size allows for greater accuracy in the estimate and reduces the likelihood of errors in calculations.
1. On the Instructions on the procedure for monitoring the effectiveness of fish protection devices and monitoring fish deaths at water intake facilities. Order No. 786 of the Federal Agency for Fisheries dated September 1, 2009. (In Russ.) URL: https://base.garant.ru/12171525/ (accessed: 10.12.2024).
2. Retaining walls, shipping locks, fish passageways and fish protection structures. Code of Rules. SP 101.13330.2023. (In Russ.) URL: https://www.minstroyrf.gov.ru/docs/318744/ (accessed: 10.12.2024).
1. Afanaseva EA, Kislyakova MD. The Main Challenges of Energy and Potential Solutions. Molodoi uchenyi. 2017;40(174):1–4. (In Russ.) URL: https://moluch.ru/archive/174/45823/ (accessed: 13.12.2024).
2. Water Bodies of the Republic of Tatarstan. Hydrographic Reference Book. Kazan: Foliant; 2018. P. 189–203. (In Russ.)
3. Bretzel JB, Doyle KE, An Vi Vu, Watts RJ, Galbusera C, Boys CA, et al. A Touch too Much — Interactions of Various Species of Freshwater Fish and Crustacea at a Simulated Fish Protection Screen. Ecological Engineering. 2024;204:107281. https://doi.org/10.1016/j.ecoleng.2024.107281
4. Ivanov AV. Safe Habitation for Protected Fish at Hydroelectric Power Plants. Power Technology and Engineering. 2023;57:26–38. https://doi.org/10.1007/s10749-023-01619-4
5. Ivanov AV. On Protecting Fish in a Hydroelectric Power Station. Power Technology and Engineering. 2022;56:529–537. https://doi.org/10.1007/s10749-023-01548-2
6. Brazhnik SYu, Ustyuzhinskii GM, Valuev KV, Goncharov SM, Menshikov SI, Leman VN, et al. Methodological Recommendations for the Collection and Processing of Hydrological and Ichthyological Research Data during Tests to Determine the Effectiveness of Fish Protection Structures (Devices). Moscow: All-Russian Scientific Research Institute of Fisheries and Oceanography; 2024. P. 52. (In Russ.)
7. Kalaida ML, Saetov AR. Water Biological Resources in the Structure of Environmental Problems of Energy Facilities. Power Engineering: Research, Equipment, Technology. 2022;24(2):175–185. (In Russ.) https://doi.org/10.30724/1998-9903-2022-24-2-175-185
8. Elham Foroozandeh, Pouya Derakhshan Barjoei. Fish Behaviors in Electromagnetic Fields. Journal of Molecular Biomarkers & Diagnosis. 2018;09(1):1000377. http://doi.org/10.4172/2155-9929.1000377
9. Christie AE. Fish Protection at Ontario Hydro Thermal Generating Stations: Recent Developments. SIL Proceedings, 1922–2010. 1985;22(4):2508. https://doi.org/10.1080/03680770.1983.11897713
10. Pavlov DS, Skorobogatov MA. Fish Migrations in Regulated Rivers. Moscow: KMK; 2014. P. 413. (In Russ.) URL: http://elib.vniro.ru/lib/document/DB4/9EBCA007-6936-4D97-8FF9-40975ACE5665/ (accessed: 17.09.2024).
11. Reshetnikov YuS. (ed.). An Annotated Catalog of Cyclostomes and Fishes of the Continental Waters of Russia. Moscow: Nauka; 1998. P. 21–219. (In Russ.) URL: https://rusneb.ru/catalog/000199_000009_000573328/ (accessed: 17.09.2024).
12. Kuznetsov MYu. Hydroacoustic Methods and Tools for Fish Stock Assessment and Fishery Maintenance. Part 1. Hydroacoustic Tools and Technologies of Their Use in Bioresource Researches of TINRO-Center. Izv. TINRO. 2013;172:20–51. (In Russ.) URL: https://www.researchgate.net/publication/291228890_Gidroakusticeskie_metody_i_sredstva_ocenki_zapasov_ryb_i_ih_promysla_Cast_1_Gidroakusticeskie_sredstva_i_tehnologii_ih_ispolzovania_pri_provedenii_bioresursnyh_issledovanij_TINRO-Centra (accessed: 17.09.2024).
Ainur R. Saetov, Postgraduate Student of the Department of Aquatic Bioresources and Aquaculture
51, Krasnoselskaya St., Kazan, 420066
Marina L. Kalaida, Dr. Sci. (Biol.), Head of the Department of Aquatic Bioresources and Aquaculture
51, Krasnoselskaya St., Kazan, 420066
Saetov A.R., Kalaida M.L. Use of Underwater Video Surveillance to Monitor a Fish Protection Device at a Thermal Power Plant Water Intake Facility. Safety of Technogenic and Natural Systems. 2025;9(1):32-41. https://doi.org/10.23947/2541-9129-2025-9-1-32-41. EDN: GZMIUV


Safety of Technogenic and Natural Systems
eISSN 2541-9129
Contact with: Publisher / Editorial Office of the Journal
Publisher: Don State Technical University - DSTU, Rostov-on-Don, Russia - https://donstu.ru/en/
Editor-in-Chief: Meskhi Besarion Chokhoevich, Doctor of Technical Sciences, Professor (Rostov-on-Don, Russia)
Don State Technical University
1, Gagarin Sq., Rostov-on-Don, 344003, Russia
tel.: +7 (863) 2738-372, e-mail: btps@donstu.ru
1, Gagarin Square, Rostov-on-Don, 344003, Russian Federation, Don State Technical University
Processing of personal data


