


Contents
Scroll to:
https://doi.org/10.23947/2541-9129-2025-9-3-185-195
EDN: SBQHNQ
Scroll to:
Introduction. Every year in the Russian Federation, approximately five thousand fires occur at production facilities, causing damage estimated in billions of rubles. To reduce the number of fires and minimize damage, work is underway to improve the methodology for calculating the number and equipment of fire protection units created to extinguish fires and conduct emergency rescue operations in organizations. This methodology was approved by Order of the Ministry of Emergency Situations of Russia dated October 15, 2021 No. 700 (hereinafter referred to as the Methodology). In the scientific literature on the analysis of fire hazards in industrial facilities in various sectors of the economy, there is a lack of a comprehensive indicator for fire hazard assessment of enterprises, which would take into account their technical and economic characteristics and industry affiliation. The aim of this study is to develop a dimensionless computing system describing the state of fire hazard of industrial facilities, taking into account their characteristic features. The developed complex was used in the formation of approaches to substantiate the number and technical equipment of facility-based fire protection units.
Materials and Methods. The analysis of statistical data on the number of fires, number of deaths and injuries, as well as the material damage caused by fires at production facilities in various economic sectors, was carried out using information from the Federal State Information System "Federal Database 'Fires'". To determine technical, economic and operational characteristics of enterprises with facility-based fire protection units, a survey was conducted using a questionnaire that collected information from 726 production facilities. Technical and economic characteristics of these facilities were studied, including: the area of land and buildings, number of employees, the mass of fire-hazardous, fire-explosive and explosive technological environments, the area of buildings and structures classified into certain categories of explosion and fire hazard, the number of fires at the enterprise, etc.
Results. A dimensionless Uпо computing system has been developed that characterizes the fire hazard level of industrial facilities. The distribution of values of the Uпо complex for production facilities where fire protection units have been established has been constructed, and the parameters of the resulting distribution have been determined. The criteria for classifying a production facility according to its fire hazard level have been established. The values of the fire hazard indicator for economic sectors have been calculated. Ferrous metallurgy (Uпо = 0.77), mechanical engineering and metalworking (0.73), non-ferrous metallurgy (0.70), and fuel industry (0.68) fell into the category of high fire hazard. The paper provides an example of calculating the fire hazard level for an electric power company.
Discussion. When determining the number and location of fire protection units, as well as the number of personnel and technical equipment, it is important to consider the level of fire risk at the production facility. An analysis of the distribution of values of the Uпо complex showed that it followed a normal distribution with an average value of m = 0.47 and a standard deviation of σ = 0.19. This meant that industries such as ferrous metallurgy and mechanical engineering had a higher level of fire risk compared to the electric power industry, which was classified as medium. The proposed method allows for an effective assessment of fire risk across different sectors of the economy.
Conclusion. The results obtained were used to develop a new version of the Methodology for calculating the number and technical equipment of fire protection units, created to extinguish fires and carry out emergency rescue operations in organizations. This methodology was approved by Order No. 700 of the Ministry of Emergency Situations of Russia dated October 15, 2021. The use of the developed complex will allow for a more accurate consideration of the specific characteristics of the production facility when determining fire protection resources.
Kondashov A.A. Development of a Computational Complex for Fire Hazard Assessment of Production Facilities, Taking into Account Their Characteristics. Safety of Technogenic and Natural Systems. 2025;9(3):185-195. https://doi.org/10.23947/2541-9129-2025-9-3-185-195. EDN: SBQHNQ
Introduction. Every year, direct material damage from fires at production facilities reaches several billion rubles, emphasizing the urgency of this issue. Fires at production sites can quickly spread over a large area due to the presence of flammable and combustible substances and materials, leading not only to significant financial losses for businesses, but also severe social consequences such as job loss, disruption of production processes, and the need for personnel evacuation. Furthermore, these fires can have severe environmental consequences, resulting in smoke and pollution of the lower atmosphere.
The study of fire hazards in various production facilities has been a subject of many studies. However, the problem of insufficient understanding of specific risks in different industries remains unsolved. This emphasizes the need for a more systematic approach to fire risk assessment. The increased danger at chemical industry facilities is due to the presence of flammable and explosive substances. A fire at these facilities can lead to severe social and economic consequences [1].
The fire and explosion hazards of metallurgical enterprises also raise legitimate concerns, since a lot of combustible dust is generated during their operations [2]. This occurs as a result of various technological processes [3]. Violations of safety regulations can directly lead to fires and explosions at such enterprises [4]. Work [5] highlights that enterprises in the forestry, woodworking, and pulp and paper industries have some of the highest fire risks. The main causes of fires include violations of electrical equipment installation and operation rules (30.5%), and careless handling of fire (20.2%) [6].
The fire hazard at power plants is caused by the handling of combustible materials, such as oils and insulating materials, as well as ignition sources related to electricity. This can lead to fires if the procedures for operating electrical equipment are not followed [7]. In the oil refining and petrochemical industries, fires often occur due to wear and tear of production equipment, violation of technological regulations [8], non-compliance with fire safety requirements [9], as well as deficiencies in the installation process [10]. The increasing complexity of production processes in this industry entails an increase in the number of flammable gases and volatile flammable liquids, which creates a real threat of large-scale fires [11]. Thus, the assessment of the fire safety of substances used at the facilities of the oil and gas complex becomes a key element in the fire safety system [12].
The occurrence of fires at mining enterprises is often associated with violations of safety regulations, malfunctions of equipment and infrastructure facilities, as well as unfavorable environmental conditions [13]. In mechanical engineering and metalworking enterprises, increased fire risk is associated with the presence of a large number of flammable materials and products [14].
Despite the extensive research on fire hazards in various industries, there is still no unified approach that can adequately assess fire hazards in different production conditions, considering their specific characteristics. The current study aims to develop a comprehensive indicator that would describe the state of fire hazard at a given production facility. This indicator will serve as a basis for substantiating the number and location of fire protection units, their staff and technical equipment.
The aim of the this research is to develop a methodology for determining fire hazard, which in turn should improve risk management practices and increase safety at production facilities. In order to achieve this, we have set out several specific objectives: to analyze existing fire hazard assessment methods, identify shortcomings in current approaches, and propose new solutions that contribute to improving the overall safety. Thus, the relevance of the research lies not only in its scientific and practical significance, but also in its ability to create the basis for further improvements in the field of fire safety.
Materials and Methods. To calculate the values of fire hazard indicators for different industries, an analysis of statistical data on fires at production facilities from 2020 to 2022 was conducted using information from the Federal State Information System “Federal Database “Fires”1. The number of enterprises in each economic sector was determined based on data provided by the Federal State Statistics Service2.
A questionnaire-based survey was conducted to determine the technical and economic characteristics of enterprises operating fire protection units. As a result, data on 726 production facilities was collected [15]. The data was analyzed, and the average values for each indicator were determined for the entire set of companies and for individual sectors.
When developing dimensionless computing complex Uпо, which characterized the fire hazard of an enterprise, the technical and economic indicators of the enterprise were normalized to the corresponding average values and multiplied by weighting factors that determined the contribution of a specific indicator. The values of fire situation indicators for economic sectors were normalized to the average values for the entire economy.
The values of dimensionless computing complex Uпо for all production facilities with fire protection units have been calculated and the distribution of Uпо values has been constructed. Average value m and standard deviation s of the obtained distribution were determined, on the basis of which the boundaries of ranges of Uпо values corresponding to different levels of fire hazard of the production facility were calculated.
Analysis of statistical data on fires in various sectors of the economy revealed the following picture. The average number of fires per 100 enterprises in all sectors of the economy was 0.75 fires per 100 enterprises. This indicator reached its maximum value at coal industry enterprises — 9.38 fires per 100 enterprises. The construction industry had the lowest number of fires — 0.14 fires per 100 enterprises (Fig. 1).
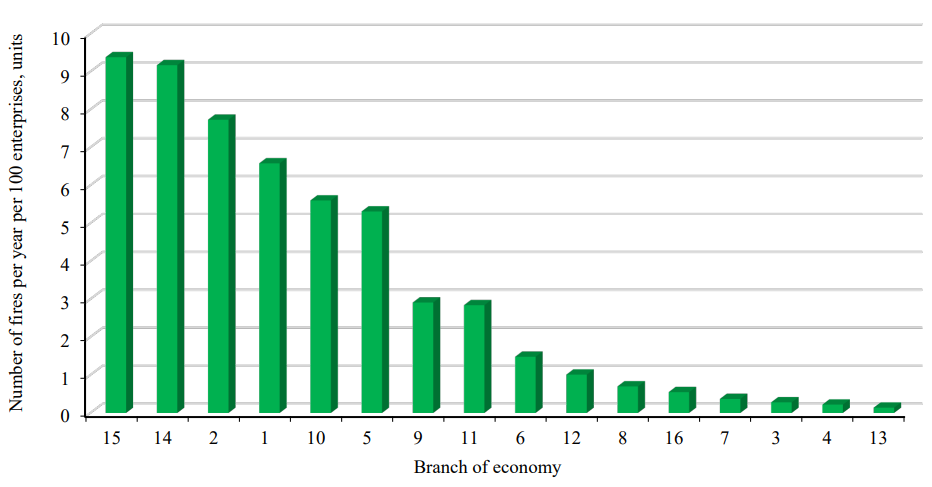
Fig. 1. Number of fires per 100 enterprises by economic sector: 1 — electric power industry; 2 — ferrous metallurgy; 3 — chemical and petrochemical industry; 4 — mechanical engineering and metalworking; 5 — forestry, woodworking and pulp and paper industry; 6 — building materials industry; 7 — light industry; 8 — food industry; 9 — agriculture; 10 — fuel industry; 11 — non-ferrous metallurgy; 12 — transport; 13 — construction; 14 — shipbuilding and ship repair; 15 — coal industry; 16 — other industries
On average, 53 people were killed or injured per 1,000 fires at production facilities. The lowest number of victims of fires was registered at electric power enterprises — 12 people per 1,000 fires. This indicator reached the highest value in the fuel industry — 452 people per 1,000 fires (Fig. 2)

Fig. 2. Number of victims (deaths and injuries) in fires per 1,000 fires by economic sector. Economic sectors are listed in the caption to Figure 1
The average amount of damage caused by a single fire ranged from 16 million rubles for enterprises in the machine-building and metalworking industries to 60 thousand rubles for enterprises in the shipbuilding and ship repair industries. The average damage from a single fire in the entire economy was 904 thousand rubles.
The analysis of technical and economic characteristics of enterprises with fire protection units revealed the following patterns. The average area of enterprises varied from 3.7 hectares for light industry to 1.81 thousand hectares for transport enterprises. The average value for all enterprises with fire protection units was 238 hectares.
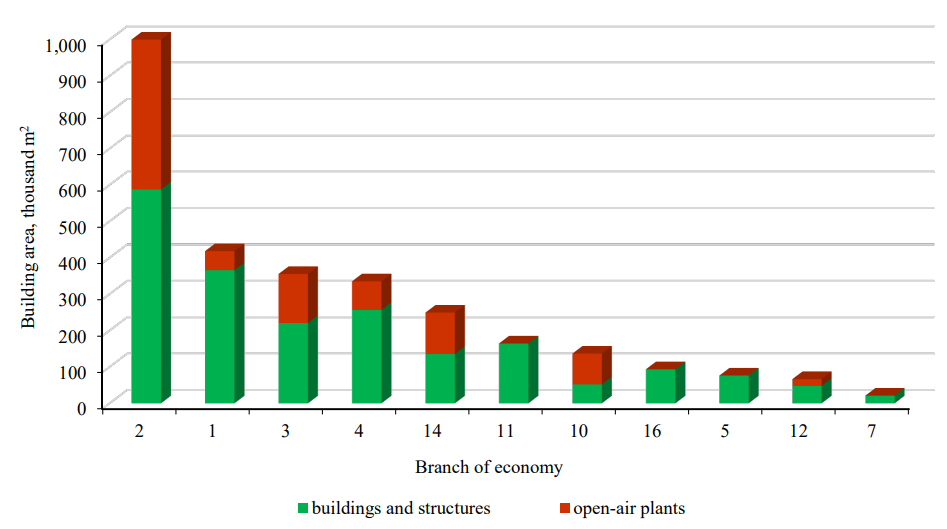
Fig. 3. Area covered by buildings, structures and open-air plants by sectors of the economy. Economic sectors are listed in the caption to Figure 1
Figure 3 provides the distribution of economic sectors by the area covered by buildings, structures and open-air plants. The largest average building area in machine-building enterprises was 587.8 thousand m2 (buildings and structures) and 413.6 thousand m2 (open-air plants). Light industry enterprises had the smallest building area with buildings and
structures — 21.1 thousand m2, and open-air plants at transport enterprises — 18.7 thousand m2. The average building area for all enterprises was 155 thousand m2 (buildings and structures) and 94 thousand m2 (open-air plants).
The number of employees at ferrous metallurgy enterprises reached the highest values, with an average of 14,400 people. Of these, 5,700 worked in the most active shift. Light industry enterprises had the lowest number of employees, with an average of 208 and 154 people, respectively. Overall, the average number of employees across all enterprises was 1,567 and 678 in the busiest shift, respectively.
The largest amount of fire-hazardous and explosive substances circulating in open-air plants was observed at electric power enterprises, averaging 177 thousand tons. The smallest amount of these substances was at machine-building and metalworking enterprises with an average of 90 tons. The average value of this indicator for all enterprises was 98 thousand tons.
The average area of buildings and structures classified as having a V degree of fire resistance for all enterprises was 5 thousand m2. This indicator reached its highest value at enterprises in the electric power industry — on average 10.1 thousand m2, and at enterprises of non-ferrous metallurgy — 138 m2.

Fig. 4. Building area of enterprises with buildings (structures) classified into certain categories of explosion and fire hazard, by economic sectors. Economic sectors are listed in the caption to Figure 1
Figure 4 shows the distribution of economic sectors by area covered by buildings of enterprises with buildings (structures) classified into certain categories of explosion and fire hazard. The largest average building area was in machine-building and metalworking enterprises — 154 thousand m2 for category A, 91 thousand m2 for category B, 224 thousand m2 for category C, and 150 thousand m2 for category D. The average building area for all enterprises in these categories was 52 thousand, 63 thousand, 91 thousand and 36 thousand m2, respectively.
The average number of fires at enterprises with fire protection units over a 5-year period was 1.2 fires per enterprise. Enterprises in the ferrous metallurgy industry had the highest number of fires, averaging 11.5 over 5 years, while enterprises in the light industry had the lowest number, averaging 0.07 over 5 years.
The average distance to local fire department, arriving at the facility in accordance with the predetermined attendance, was 12.6 km. The longest distance was for chemical and petrochemical enterprises, with an average distance of 28.7 kilometers, while the shortest distance was for mechanical engineering enterprises, with an average distance of only 3.5 kilometers.
Results. Based on the analysis results, dimensionless computing complex Uпо has been developed to assess the fire hazard level of industrial facilities, which is calculated using the formula:
 (1)
(1)
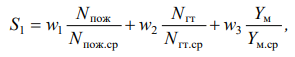
S1 dimensionless complex, included in (1), characterizes the fire hazard level of the industry to which the production facility in question belongs. To calculate S1, the formula is used:
 (2)
(2)
where wi — dimensionless weighting factors, taken equal to 2/19; Nпож, Nгт, Yм — indicators characterizing the fire hazard of the industry, shown in Table 1; Nпож.ср, Nгт.ср, Yм.ср — average values of fire hazard indicators for all industries.
Table 1
Indicators characterizing the fire hazard of the industry
|
No. |
Symbol |
Name of the indicator |
Unit of measurement |
|
1 |
Nпож |
Number of fires per 100 enterprises per year |
units |
|
2 |
Nгт |
Number of people affected by fires, per 1,000 fires |
people |
|
3 |
Yм |
Average damage from one fire |
rub. |
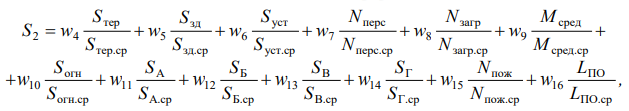
S2 dimensionless complex describes technical, economic and operational characteristics of a specific production facility. To calculate S2, the formula is used:
 (3)
(3)
where wi — dimensionless weighting factors, taken equal to 1/19; Sтер, Sзд, Sуст, Nперс, Nзагр, Mсред, Sогн, SА, SБ, SВ, SГ, Nпож, LПО — indicators characterizing technical, economic and operational characteristics of the facility (Table 2); Sтер.ср, Sзд.ср, Sуст.ср, Nперс.ср, Nзагр.ср, Mсред.ср, Sогн.ср, SА.ср, SБ.ср, SВ.ср, SГ.ср, Nпож.ср, LПО.ср — average values of indicators for facilities with fire protection units.
Table 2
Indicators characterizing technical, economic and operational characteristics of a production facility
|
No. |
Symbol |
Name of the indicator |
Unit of measurement |
|
1 |
Sтер |
Area of the territory |
ha |
|
2 |
Sзд |
Area covered by buildings and structures |
m2 |
|
3 |
Sуст |
Area covered by open-air plants |
m2 |
|
4 |
Nперс |
Total number of staff |
people |
|
5 |
Nзагр |
Number of facility staff working during the busiest shift |
people |
|
6 |
Mсред |
Mass of fire hazardous and explosive technological environments simultaneously circulating in open-air plants |
t |
|
7 |
Sогн |
Area of buildings and structures belonging to the V degree of fire resistance |
m2 |
|
8–11 |
SА, SБ, SВ, SГ |
Area of buildings (structures) classified as explosion and fire hazard categories A, B, C, D |
m2 |
|
12 |
Nпож |
Number of fires at the enterprise over 5 years |
units |
|
13 |
LПО |
Distance to the local fire department unit arriving at the production facility in accordance with the predetermined attendance |
km |
The distribution of Uпо complex values for production facilities with fire protection units is described by a normal law with average value m = 0.47 and standard deviation σ = 0.19. Table 3 provides the criteria for classifying a production facility as a certain category of fire hazard.
Table 3
Fire hazard levels of the production facility and their corresponding values of Uпо complex
|
Fire hazard category |
Criteria |
Range of values |
|
Low |
0 ≤ Uпо < m |
0 ≤ Uпо < 0.47 |
|
Average |
m ≤ Uпо < m + σ |
0.47 ≤ Uпо < 0.66 |
|
High |
m + σ ≤ Uпо < m + 2σ |
0.66 ≤ Uпо < 0.85 |
|
Extremely high |
m + 2σ ≤ Uпо < 1 |
0.85 ≤ Uпо < 1 |
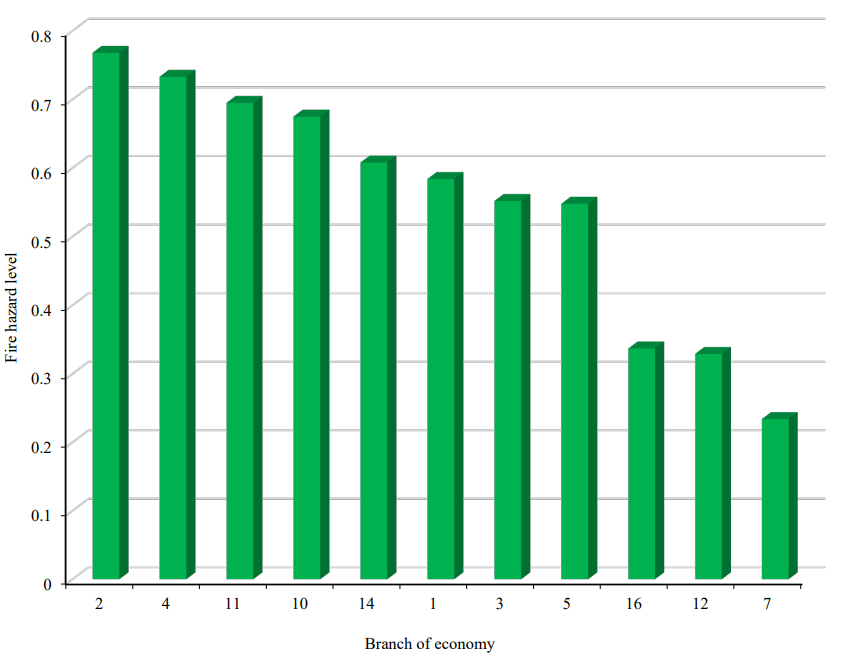
Fig. 5. Distribution of economic sectors by fire hazard level. Economic sectors are listed in the caption to Figure 1
Figure 5 provides the average values of Uпо complex for economic sectors. As can be seen in the figure, ferrous metallurgy, mechanical engineering, metalworking, and non-ferrous metallurgy as well as the fuel industry fall into the category of high fire danger. The category of medium fire danger includes the following industries: shipbuilding and ship repair, electric power industry, chemical and petrochemical industry, forestry, woodworking and pulp and paper industry. Other industries belong to the category of low fire danger.
As an example, the fire hazard level for electric power industry enterprises is calculated. Table 4 shows the significance of technical, economic, and operational characteristics of the enterprise.
Table 4
Values of indicators characterizing the fire hazard state of an electric power production facility
|
Indicator |
Value |
Indicator |
Value |
|
Y1, ha |
17.0 |
Y8, hous. m2 |
2.6 |
|
Y2, thous. m2 |
33.5 |
Y9, thous. m2 |
0.5 |
|
Y3, thous. m2 |
0.0 |
Y10, thous. m2 |
8.0 |
|
Y4, people |
236.0 |
Y11, thous. m2 |
12.5 |
|
Y5, people |
184.0 |
Y12, units |
0.0 |
|
Y6, thous. tons |
2,540.5 |
Y13, km |
13.0 |
|
Y7, thous. m2 |
0.0 |
|
|
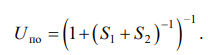
Using formulas (2) and (3), we find the value of complexes S1 = 0.962 and S2 = 1.424. The value of Uпо computing complex is determined by formula (1), Uпо = 0.705. According to Table 3, the company is considered to have a high fire risk, while the electricity industry in general is considered to be at medium risk (Fig. 5).
Discussion. In the course of our research, we aimed to identify the level of fire hazard at production facilities, considering technical and economic characteristics of individual enterprises. The implemented model allows for the assessment of risks, taking into account the specific features of various industries. The main findings indicate that the level of fire hazard depends on the type of activity, with industries such as ferrous and non-ferrous metallurgy, mechanical engineering, metalworking, and the fuel sector having significantly higher levels of risk than the average.
The created dimensionless computing complex — Uпо — makes it possible to analyze the fire hazard of production facilities more deeply, taking into account various factors, including the distance to the local fire protection unit, the mass of fire hazardous and explosive technological environments in circulation, the area occupied by buildings and structures classified into certain categories of explosion and fire hazard, the number of fires at the enterprise, etc. These factors should be taken into account when determining the resource requirements of fire protection units.
Thus, the results of the work not only confirm the existing hazards in the field of fire safety, but also emphasize the need to adapt the system to the conditions of specific industries for effective risk management. This creates the basis for further recommendations and actions aimed at reducing the number and consequences of fires.
Conclusion. The results obtained were used to develop a new version of the Methodology for calculating the number and technical equipment of fire protection units created to extinguish fires and conduct emergency rescue operations in organizations. This Methodology was approved by Order of the Ministry of Emergency Situations of Russia No. 700 dated October 15, 2021. In the new version of the Methodology, it is proposed to calculate the service radius of the fire department depending on the level of fire danger of the production facility, determined by Uпо indicator. The fire hazard of the facility is also taken into account to determine the required consumption of extinguishing agent for outdoor firefighting when calculating the composition of fire protection forces and equipment. Furthermore, the areas under fire safety control during fire prevention are determined based on the value of Uпо complex indicator.
The results of the research on the rationing of fire protection facilities will be discussed in more detail in a series of future publications.
1. On the Formation of Electronic Databases for Accounting for Fires and Their Consequences. Order of the Ministry of Emergency Situations of Russia No. 625 dated December 24, 2018. GARANT. (In Russ.) URL: https://base.garant.ru/72138544/ (accessed: 11.05.2025).
2. Russian Statistical Yearbook. 2022. Federal State Statistics Service: Moscow: 2022. 696 p. (In Russ.) URL: https://rosstat.gov.ru/storage/mediabank/Ejegodnik_2022.pdf (accessed: 11.05.2025)
1. Smirnov AV. On Fire Safety Management Structure at a Typical Chemical Industry Facility. In: Problems of Technosphere Safety: Proceedings of the International Scientific and Practical Conference of Young Scientists and Specialists. 2017;(6):426–430. (In Russ.)
2. Fedorov VA. Assessment of Fire and Explosion Safety of Metallurgical Industry Enterprises in Terms of Production Related to the Handling of Combustible Dust. Fire and Technosphere Safety: Problems and Ways of Improvement. 2021;3(10):456–460. (In Russ.)
3. Moroń W, Ferens W. Analysis of Fire and Explosion Hazards Caused by Industrial Dusts with a High Content of Volatile Matter. Fuel. 2024;355:129363. https://doi.org/10.1016/j.fuel.2023.129363
4. Polyanin AV. Increasing the Level of Safety for Participants of Fire Extinguishing at the Facilities of the Metallurgical Industry. In: Proceedings of the III International Scientific and Practical Conference “Scientific Research 2022”, Penza, September 15, 2022. Penza: Science and Education (IP Gulyaev G.Yu.); 2022. P. 30–32. (In Russ.)
5. Kornyukhin IS, Ermilov AV. Analysis of Statistical Data on Fires in the Woodworking Industry. In: Proceedings “Current Issues of Firefighting”, Ivanovo, May 15, 2020. 2020. Ivanovo: Federal State Budgetary Educational Institution of Higher Education “Ivanovo Fire and Rescue Academy of the State Fire Service of the Ministry of the Russian Federation for Civil Defense, Emergencies and Elimination of Consequences of Natural Disasters”; P. 68–73. (In Russ.)
6. Kundysheva MV. Analysis of Sources of Danger in a Woodworking Enterprise. In: Proceedings of the International Scientific and Practical Conference “The Arctic: Modern Approaches to Industrial and Environmental Safety in the Oil and Gas Sector” Tyumen, November 29, 2023. Tyumen: Tyumen Industrial University; 2024. P. 109–112. (In Russ.)
7. Aleshkov MV, Pushkin DS, Kolbasin AA. Features of Development and Suppression of Fires on Objects of Power. Technosphere Security Technologies. 2010;(3(31));9. (In Russ.)
8. Maltsev AV. Analysis of the Causes of Fires at Oil Refining Facilities. Fire Safety: Problems and Prospects.2017;1(8):278–280. (In Russ.)
9. Pshenichnyi DS. Analysis of the causes and Methods of Extinguishing Fires at Gas Industry Facilities. In: Proceedings of the X All-Russian Scientific and Technical Conference of Young Researchers “Actual Problems of Construction, Housing and Communal Services and Technosphere Safety”, Volgograd, April 24–29, 2023. Volgograd: Volgograd State Technical University; 2023. P. 260–262. (In Russ.)
10. Fedorov AV, Ospanov KK, Lomaev EN, Aleshkov AM, Mintsaev MSh. Statistical and Causal Factors Analysis of Accidents at Oil Refining and Petrochemical Industry of Russia and Kazakhstan. Technosphere Security Technologies. 2021;(2(92)):156–168. (In Russ.) https://doi.org/10.25257/TTS.2021.2.92.156-168
11. Kalach AV, Cherepakhin AM, Sushko EA, Kalach EV, Sysoeva TP. The Dangerous Fire Factors Formation the on an Oil and Gas Complex Objects When Using the Combustible Environment on the Tetrachlormethane Basis. IOP Conference Series: Earth and Environmental Science. 2020;459:042046. https://doi.org/10.1088/1755-1315/459/4/042046
12. Gvozdev E. Development of an Integrated Safety Sistem for Production Facilities: the Problem Statement and the Proposed Solution. Reliability: Theory & Applications. 2024;19(1(77)):474–487. https://doi.org/10.24412/1932-2321-2024-177-474-487
13. Aldiyansyah Aldiyansyah, Al Amin Siharis, Abriansyah Abriansyah, Fitrani Amin, Aqsal Ramadhan. Kegiatan Sosialisasi Keselamatan Dan Kesehatan Kerja Pada Tambang Batu Gamping di PT. Diamond Alfa Propertindo Kabupaten Buton Tengah. Anoa: Jurnal Pengabdian Masyarakat Fakultas Teknik. 2023;2(1):58–62. https://doi.org/10.51454/anoa.v2i01.453
14. Savelyev AP, Glotov SV, Chugunov MN, Enaleeva SA. Fire Safety at Medium-Size Machine-Building Facilities. Russian Engineering Research. 2022;42(4):373–375. https://doi.org/10.3103/S1068798X22040268
15. Marakhov PA, Poroshin AA, Streltsov OV, Kondashov AA, Bobrinev EV, Udavtsova EY. Formation of an Information Base for Calculating the Resource Provision of Fire Protection to Protect Organizations from Fires. Modern Problems of Civil Protection. 2024;(3(52)):22–29. (In Russ.) URL: https://ntp.edufire37.ru/uploads/2024/09/%D0%A1%D0%9F%D0%93%D0%97_352_2024.pdf (accessed: 11.05.2025).
Andrey A. Kondashov - Cand. Sci. (Phys.-Math.), Leading Researcher of the All-Russian Research Institute of Fire Protection of the Ministry of the Russian Federation for Civil Defense, Emergencies and Elimination of Consequences of Natural Disasters.
12, VNIIPO, Balashikha, mkr., 143903
Scopus ID 6604071787
Kondashov A.A. Development of a Computational Complex for Fire Hazard Assessment of Production Facilities, Taking into Account Their Characteristics. Safety of Technogenic and Natural Systems. 2025;9(3):185-195. https://doi.org/10.23947/2541-9129-2025-9-3-185-195. EDN: SBQHNQ


Safety of Technogenic and Natural Systems
eISSN 2541-9129
Contact with: Publisher / Editorial Office of the Journal
Publisher: Don State Technical University - DSTU, Rostov-on-Don, Russia - https://donstu.ru/en/
Editor-in-Chief: Meskhi Besarion Chokhoevich, Doctor of Technical Sciences, Professor (Rostov-on-Don, Russia)
Don State Technical University
1, Gagarin Sq., Rostov-on-Don, 344003, Russia
tel.: +7 (863) 2738-372, e-mail: btps@donstu.ru
1, Gagarin Square, Rostov-on-Don, 344003, Russian Federation, Don State Technical University
Processing of personal data


