


Contents
Scroll to:
https://doi.org/10.23947/2541-9129-2025-9-3-221-229
EDN: ZHEYTV
Scroll to:
Introduction. Modern materials require a deep understanding of their structure in order to predict their performance properties. However, the use of various imaging techniques and programs, such as optical and electron microscopy, is limited to two-dimensional images, making it difficult to fully analyze the morphology of materials. Despite research in this field, there is still a lack of knowledge about the three-dimensional organization of materials, leading to gaps in our understanding of how geometry affects the physical properties of composite materials. ImageJ was chosen for this study due to its versatility and ability to support multiple formats, simplifying the process of analysis. It also offers powerful tools for automated processing and allows users to extract three-dimensional information from two-dimensional images. This is crucial for accurately identifying structural components. The current study aims to fill in the missing information by analyzing the morphology of a steel ferrite-martensite composite. The aim of the work is to determine the 3D surface structure of the composite, which will improve understanding of its performance characteristics and confirm the significance of selecting appropriate visualization techniques.
Materials and Methods. An image of the microstructure of a steel natural ferrite-martensitic composite (NFMC), obtained using a Metam PB–22 optical microscope, was chosen as the starting material for analysis. The microstructure in question consists of two phases: the light phase being ferrite and the dark phase being martensite. The ImageJ program, which has been adapted to various formats of electron microscopic and metallographic images, was used to obtain a wide range of geometric characteristics of the surface.
Results. A study using ImageJ software on the microstructure of a steel ferrite-martensitic composite revealed a characteristic lineage structure consisting of a light phase (ferrite) and a dark phase (martensite). Image processing, including scaling and segmentation, led to the conversion to black and white format, allowing for clear visualization of the boundaries between the phases and the geometric shapes of the particles. The four-parameter Rodbard calibration function provided additional data on area, standard deviation, skewness, and kurtosis, making it difficult to analyze the structure. As a result, ferrite occupied 40.8% of the area, while martensite occupied 59.2%. The surface profile revealed an alternating pattern of misoriented crystals, and the quantitative information allowed for the creation of a clear 3D image of the composite surface.
Discussion. The thickness of grain boundaries in pixels was found to be thinner in this graphic editor than in others, which affected the area and, consequently, the amount of light phase. The change in the quantitative ratio of ferrite-martensite phases was due to the program's ability to suppress image “noise” and more clearly read the unrecognized gray phase, with some of it belonging to the light phase and some to the dark phase.
With the advancement of technology and the increasing demands for strength and wear resistance, understanding the microstructure of materials has become crucial for optimizing their properties. The selection of appropriate imaging techniques, such as the use of ImageJ software, not only allows for accurate data on phase distribution, but also contributes to a more in-depth analysis of mechanical properties such as hardness and corrosion resistance. These aspects are important in the context of the development of innovative technologies where reliability and durability are essential factors.
Conclusion. The use of the ImageJ software package for visualization in 2D and 3D graphics and qualitative and quantitative analysis of the surface morphology of heterogeneous structural states of materials is a convenient, effective and informative way to obtain geometric characteristics of particles of structural components. It is also possible to map the shape and size of particles. Automation of this process leads to time and resource savings, minimizing the influence of subjective factors on results at different stages of analysis. Identification of the 3D surface structure of composites helps to deepen our understanding of their operational characteristics, which is crucial in the context of modern technological demands. This knowledge allows us to develop new materials with improved properties such as strength, wear and corrosion resistance. Furthermore, it enables us to predict how materials will perform in actual conditions.
Duka V.V., Aref’eva L.P. Surface Morphology Identification of Steel Natural Ferrite-Martensitic Composite Using ImageJ Software. Safety of Technogenic and Natural Systems. 2025;9(3):221-229. https://doi.org/10.23947/2541-9129-2025-9-3-221-229. EDN: ZHEYTV
Introduction. Currently, many techniques and specialized computer programs are actively used in the field of materials science, allowing for the expansion of visualization capabilities for material structures through increased resolution. This, in turn, increases the likelihood of predicting operational properties. The morphology of the surface, its chemical composition, and structural components are key indicators in the study of the structure of materials, as they directly influence material properties, behavior, and performance characteristics. Traditional methods for determining surface morphology include several techniques that allow for assessing topography, roughness, structure and defects of the surface. These include optical microscopy, scanning electron microscopy, transmission electron microscopy, profilometry, and others. However, all these methods, despite their widespread use, only allow for the acquisition of two-dimensional images. This limits the information that can be obtained about the surface relief formed by the phase composition of the material. Additionally, these methods are typically destructive in nature. At the same time, the use of software algorithms based on modern digital technologies allows for the extraction of three-dimensional (3D) information from two-dimensional images of structures without losing resolution. This also enables efficient storage and quick interpretation of 3D images at both micro- and nano-levels. Electronic 3D structural images enhance the reliability of morphological organization of the material due to precision detail. This allows for precise estimation of geometric dimensions of structural components and local determination of their physical and mechanical properties, minimizing errors. When selecting programs for visualizing 3D images, it is essential to consider the goals and objectives of the study, as well as the convenience of working with the interface and its functionality. Currently, there is a wide range of image processing applications with a diverse set of capabilities. Among the available software packages such as Adobe Photoshop [1], Gimp [2], CellProfiler [3], Huygen [4], Leica QWin [5], Gwyddion, ImageJ stands out for its versatility, support for multiple formats, flexibility, performance and automation capabilities. These qualities make it especially in demand when working with images [6]. The digital image processing method for analyzing the surface relief using the ImageJ program allows extracting 3D information from 2D images obtained through optical microscopy without losing resolution [7]. This is particularly important for identifying the morphology of composite structural components and then interpreting its properties as a whole. In this study, we use the ImageJ software for the first time to study a natural ferrite-martensitic composite [8]. The aim of the work is to identify the surface morphology of natural steel ferrite-martensitic composite using ImageJ software.
Materials and Methods. The object of the study was an image of the microstructure of a natural ferrite-martensitic composite obtained using a Metam PB–22 optical microscope [9].
To obtain additional information about the structural state of NFMC, the ImageJ program was used. It was adapted to various formats of electron microscopic and metallographic images [10]. The program allows you to calculate the area, length, volume, perimeter, and angular dimensions of the surface of structural components, including statistical indicators both in pixel values and in the SI system [11]. In this case, the geometric characteristics were determined as a result of sequential mapping of the structure (Fig. 1) with subsequent integration of the entire image area [12].

Fig. 1. Sequential mapping of the NFMC structure
The “Set Measurements” option of the program allows users to calculate both total and relative area of particles in structural components, as well as their average size [9–12, 13]. The four-parameter Rodbard calibration function, according to Equation 1, accurately identifies the shades of black and white by analyzing the pixel intensity along a line inside the image and converts a 2D surface into a 3D image [13, 14].
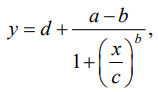 (1)
(1)
where у — function value; х — independent variable; d — maximum function value (upper asymptote); а — minimum function value (lower asymptote); b — parameter that determines the slope (steepness) of the curve; с — value at which the function takes a value equal to the midpoint between а and d.
NFMC is a composite material based on hot-rolled pre-eutectoid 14G2 structural steel with an initial ferrite-pearlite lineage structure. After quenching from the inter-critical temperature range (ITR), the structure of such a composite consists of alternating layers of ferrite and martensite, which act as a reinforcing component. This structure makes it possible to obtain an unusual ratio of high plasticity, viscosity, and strength.
It is known that in NFMC, the main indicators of mechanical, physical and operational properties are determined by the chemical composition and the quantitative phase ratio. The ratio of the volume fractions of ferrite and martensite as well as the microhardness of the hardening phase depend on the ITR tempering temperature. It was found that when quenched at a temperature of 730°С the volume fraction of the martensitic component did not exceed 25–30%, and its microhardness was 735–740 MPa. When quenched at a higher temperature of 780°C, a martensite structure was formed with a higher volume fraction of 55–60%, but with a lower microhardness of 450–455 MPa. The decrease in microhardness was due to the fact that with an increase in the quenching temperature in the ITR, the amount of carbon in martensite decreased [15].
Results. Figure 2 a, obtained using a Metam PB–22 optical microscope, shows the characteristic lineage structure of NFMC, which consists of layers of a light phase — ferrite, and a dark phase — martensite. However, it was difficult to detail the structural components. After preprocessing the image by sequentially scaling, segmentation, and extraction of geometric characteristics, ImageJ converted the image to a black-and-white 8-bit format (Fig. 2 b), where each pixel was a single byte value in the range from 0 to 255, indicating brightness. This increased the contrast of the image, making the geometric shapes of the particles and boundaries between phase layers more visible. This significantly expanded the possibilities for structural analysis of 2D images of the heterogeneous morphology of natural ferrite-martensitic composite [16].

Fig. 2. NFMC microstructure after hardening from ITR (light area — ferrite, dark area — martensite): a — NFMC microstructure before processing in the ImageJ program; b — NFMC microstructure after conversion to black-and-white graphics using the ImageJ computer program
The use of a four-parameter Rodbard calibration function (Fig. 3) made it possible to extract additional information on the structural components parameters set in the “Set Measurements” option — the total study area, standard deviation, asymmetry, and kurtosis of the pixel image, the fraction of the area and the perimeter of the analyzed phases. The values of these parameters, after scaling, are presented in Table 1.
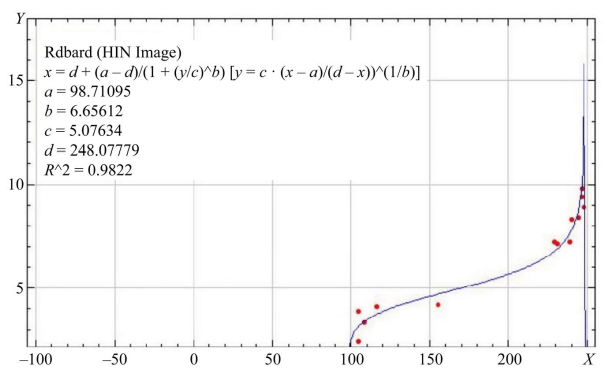
Fig. 3. Rodbard's four-parameter calibration function, on the X-axis — distance along the line, on the Y-axis — pixel intensity
Table 1
The results of the specified measurements in the “Set Mesurements” dialog box
|
Parameter |
Meaning |
|
Area (pxl)/(µm2) |
313,908 / 66,789 |
|
Standard deviation |
124.7 |
|
Skewness |
0.4 |
|
Area fraction of the light phase — ferrite (%) |
40.8 |
|
Area fraction of the dark phase — martensite (%) |
59.2 |
|
Mean gray value |
101.0 |
|
Perimeter(pxl)/(µm) |
2,248 / 478.3 |
|
Kurtosis |
–1.8 |
Based on the data obtained, a two-dimensional graph of the profile was constructed (Fig. 4). From this graph, it was concluded that a lineage structure was formed on the NFMC surface, the distinctive feature of which was the presence of alternating layers of martensite and ferrite consisting of crystals disoriented in space. This could be seen by the local maxima and minima in the profile.
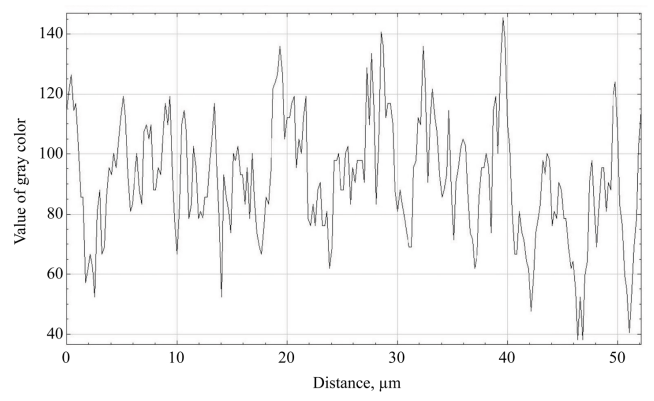
Fig. 4. NFMC surface profile
The use of the “Analyze Particles” function, which was built into the “Set Measurements” option, allowed objects to be filtered by size and shape. This made it possible to determine the total and relative areas of the structural components in question, as well as their average size. Thus, the total number of dark and light phase particles over the entire image area was 1,088, of which 27,316 µm² or 40.8% of the total area of 66,789 µm² was occupied by a light ferritic component with an average size of 4.72 µm, and the remaining proportion of 39,473 µm² or 59.2% was occupied by a dark martensite phase with an average size of 5.29 µm. Quantitative information about the location and intensity of pixels allowed us to obtain a clear 3D image of the NFMC surface profile (Fig. 5)

Fig. 5. 3D image of the NFMC surface profile
Discussion. It is known from [17][18] that the percentage ratio of ferrite and martensite phases after quenching at 790–800°C averages 35/65–30/70. The quantitative ratio of ferrite and martensite in the image studied in the ImageJ program turned out to be, respectively, ~ 40/60. The deviation of the data obtained from the results of [17][18] is explained by the fact that the ImageJ program processes images based on peak intensity, which makes it possible to view grain boundaries more accurately. The thickness of the grain boundaries, measured in pixels, turns out to be thinner than in other graphic editors, which, in turn, changes the area and the corresponding amount of light phase. The change in the quantitative ratio of the ferrite-martensite phases is due to the fact that the “noise” of the image is suppressed in the program, and the unrecognized gray phase is read more clearly: part of it belongs to the light phase, and part to the dark one. The results obtained make it possible to more accurately quantify the degree of heterogeneity and the location of ferrite and martensite in the studied image. The results are in good agreement with the work data and generally correspond to the visual images obtained.
Conclusion. The ImageJ program offers convenient tools for visualizing and documenting the results of studies on heterogeneous structural states of materials with various functional purposes. It allows users to create reports with visual illustrations in 2D and 3D graphics formats. A wide range of built-in options enables users to evaluate various geometric parameters of particle morphology and, based on this, analyze shape, size, location, quantity, and even perform mapping. The use of this software package to study the NFMC surface morphology by processing photographs of the microstructure significantly increases the efficiency, accuracy and objectivity of the study. Automating the process significantly saves time and human resources, as well as minimizes data variability associated with manual processing. The use of such tools is especially beneficial when combined with traditional data collection methods, as it allows for a more comprehensive and reliable understanding of the properties and structure of materials.
1. Tim Gräning, Lizhen Tan, Ishtiaque Robin, Yutai Katoh, Ying Yang. A Novel Design of Transitional Layer Structure between Reduced Activation Ferritic Martensitic Steels and Tungsten for Plasma Facing Materials. Journal of Materials Research and Technology. 2023;24:4285–4299. https://doi.org/10.1016/j.jmrt.2023.04.019
2. Garcia JuM, Accioly Monteiro AC, Barcelos Casanova AM, Checca Huaman NR, Monteiro SN, Brandao LP. Microstructural Analysis of Phase Precipitation during High Temperature Creep in AISI 310 Stainless Steel. Journal of Materials Research and Technology. 2023;23:5953–5966. https://doi.org/10.1016/j.jmrt.2023.02.175
3. Karin P, Chammana P, Oungpakornkaew P, Rungsritanapaisan P, Amornprapa W, Charoenphonphanich C, et al. Impact of Soot Nanoparticle Size and Quantity on Four-Ball Steel Wear Characteristics Using EDS, XRD and Electron Microscopy Image Analysis. Journal of Materials Research and Technology. 2022;16:1781–1791. https://doi.org/10.1016/j.jmrt.2021.12.111
4. Setareh Medghalchi, Ehsan Karimi, Sang-Hyeok Lee, Benjamin Berkels, Ulrich Kerzel, Sandra Korte-Kerzel. Three-Dimensional Characterisation of Deformation-Induced Damage in Dual Phase Steel Using Deep Learning Journal Materials & Design. 2023;232:112108. https://doi.org/10.1016/j.matdes.2023.112108
5. Starovoitov VV, Golub YuI. Digital Images. From Receipt to Processing. Minsk: UIIP NAS of Belarus; 2014. 202 p. (In Russ.)
6. Pustovoit VN, Dolgachev YuV, Dombrovskii YuM, Duka VV. The Structure and Properties of a Natural Steel Ferritic-Martensitic Composite. Metallovedenie i Termicheskaya Obrabotka Metallov. 2020;(6(780)):15–21. (In Russ.) URL: https://mitom.folium.ru/index.php/mitom/article/view/251 (accessed: 01.06.2025).
7. Vernezi NL, Rusakov VA. On the Control of Metal Strength of Structural Elements of Floating Cranes. Safety of Technogenic and Natural Systems. 2022;(3):50–51. https://doi.org/10.23947/2541-9129-2022-3-48-53
8. Pustovoit VN, Dolgachev YuV, Dombrovskii YuM. Ballistic Resistance of Steel with the Structure of a Natural Ferrite-Martensitic Composite. Safety of Technogenic and Natural Systems. 2022;(3):54–59. https://doi.org/10.23947/2541-9129-2022-3-54-59
9. Zilbergleit MA, Temruk VI. Package ImageJ. Application for Image Processing Obtained Scanning Electronic Microscopy (Paper Analysis). Polymer Materials and Technologies. 2017:3(1):71–74. (In Russ.)
10. Ioffe AI. Method for Estimation of a Given Area Relief Roughness. Earth Research from Space. 2013;(3):92–94. (In Russ.) https://doi.org/10.7868/S0205961413020048
11. Burger W, Burge MJ. Digital Image Processing. An Algorithmic Introduction Using Java. Second Edition. London: Springer; 2016. 811 p.
12. Atroshenko SA, Maier SS, Smirnov VI. Structural Phase State of the Metal of a Rail with an Internal Crack after Long-Term Operation. Zhurnal Tekhnicheskoi Fiziki. 2021;91(9):1363–1368. (In Russ.) https://doi.org/10.21883/JTF.2021.09.51215.72-21
13. Torres AL, Bidarra SJ, Pinto MT, Aguiar PC, Silva EA, Barrias CC. Guiding Morphogenesis in Cell-Instructive Microgels for Therapeutic Angiogenesis. Biomaterials. 2018;154:34–47. https://doi.org/10.1016/j.biomaterials.2017.10.051
14. Rueden CT, Schindelin J, Hiner MC, DeZonia BE, Walter AE, Arena ET. ImageJ2: ImageJ for the Next Generation of Scientific Image Data. BMC Bioinformatics. 2017;18(1):529. https://doi.org/10.1186/s12859-017-1934-z
15. Duka VV, Pustovoit VN, Ostapenko DA, Arefèva LP, Dombrovskij YuM. The Use of the Atomic Force Microscopy to Investigate the Structure of Steel 14G2. IOP Conference Series: Materials Science and Engineering. 2019;680:012023. https://doi.org/10.1088/1757-899X/680/1/012023
16. Duka VV, Aref`eva LP, Pustovoit VN, Kiseleva DA. Study of the Lineage Structure of Building Steel by Atomic Force Microscopy. Letters on Materials. 2020;10(4(40)):445–450. (In Russ.) https://doi.org/10.22226/2410-3535-2020-4-445-450
17. Aref'eva LP, Duka VV, Zabiyaka IY. Relationship between the Structural-Phase Composition and the Fracture Mechanism of High-Strength Contruction Steel. Technical Physics Letters. 2022;48(8):39–42. (In Russ.) https://doi.org/10.21883/PJTF.2022.08.52366.19093
18. Duka VV, Aref'eva LP, Mitrin BI, Pustovoit VN. Investigation of the Fracture Structure of a Composite Material after Bending Test by Atomic Force Microscopy. IOP Conference Series: Materials Science and Engineering. 2021;1029:012059. https://doi.org/10.1088/1757-899X/1029/1/012059
Valentina V. Duka - Senior Lecturer of the Department of Materials Science and Technology of Metals, Don State Technical University.
1, Gagarin Sq., Rostov-on-Don, 344003
Scopus ID 57204642574
Lyudmila P. Aref’eva - Dr. Sci. (Phys.-Math.), Associate Professor, Associate Professor of the Department of Materials Science and Technology of Metals, Don State Technical University.
1, Gagarin Sq., Rostov-on-Don, 344003
Scopus ID 24176599100; ResearcherID J-4075-2017
Duka V.V., Aref’eva L.P. Surface Morphology Identification of Steel Natural Ferrite-Martensitic Composite Using ImageJ Software. Safety of Technogenic and Natural Systems. 2025;9(3):221-229. https://doi.org/10.23947/2541-9129-2025-9-3-221-229. EDN: ZHEYTV


Safety of Technogenic and Natural Systems
eISSN 2541-9129
Contact with: Publisher / Editorial Office of the Journal
Publisher: Don State Technical University - DSTU, Rostov-on-Don, Russia - https://donstu.ru/en/
Editor-in-Chief: Meskhi Besarion Chokhoevich, Doctor of Technical Sciences, Professor (Rostov-on-Don, Russia)
Don State Technical University
1, Gagarin Sq., Rostov-on-Don, 344003, Russia
tel.: +7 (863) 2738-372, e-mail: vestnik@donstu.ru
1, Gagarin Square, Rostov-on-Don, 344003, Russian Federation, Don State Technical University
Processing of personal data


