


Contents
Scroll to:
https://doi.org/10.23947/2541-9129-2025-9-4-284-293
EDN: YTBWWQ
Scroll to:
Introduction. Researchers at the Southern Scientific Center of the Russian Academy of Sciences have repeatedly observed abundant microalgae blooms in Taganrog Bay, which negatively impact the health of people, animals, the environment, as well as the economy. Given the increasing depletion of biodiversity and deterioration of water quality in the Azov Sea due to reduced freshwater inflow, rising water temperatures, and increased nutrient runoff, the risk of toxic phytoplankton populations is increasing. This threatens the ecosystem, regional economy, and health of local residents. The rise in average annual temperatures and increased nitrogen and phosphorus runoff caused by urbanization and agriculture leads to accelerated growth of cyanobacteria, particularly during warmer months. This results in abundant blooms with the potential for toxicity, especially in Taganrog Bay. Models of phytoplankton population dynamics exist at the lag-phase and reactive norm levels. However, their adaptation to the conditions of the Azov Sea requires the consideration of the specific variations in depth, salinity, and seasonal characteristics. The aim of this study is to construct medium-term forecasts for the development of cyanobacteria using an integrated approach based on the application of mathematical modeling methods.
Materials and Methods. Phytoplankton population dynamics were predicted using a three-dimensional, non-stationary mathematical model based on a system of non-stationary partial differential equations with nonlinear source functions. The input data for the model included values of water flow vector components from a hydrodynamic model, as well as measurements of salinity, temperature, nutrient concentrations, and phytoplankton populations from long-term observations. Difference approximation of the model was performed using explicit-implicit splitting schemes. A depth interpolation method was used to construct a three-dimensional computational domain. The described method was also applied to interpolate salinity and temperature values based on cartographic information.
Results. A numerical experiment yielded three-dimensional distributions of cyanobacteria and green algae in Taganrog Bay during the growing season. The experiment considered the effects of salinity and temperature, as well as the nutrient limitation of phytoplankton populations. The interpolation method resulted in a depth map, salinity, and temperature distributions that were relatively smooth at the junction points, and served as input data for the model.
Discussion. The mathematical model of the dynamics of phytoplankton populations presented in this paper takes into account the conditions for the development of blue-green and green algae and their environmental impact. It allows us to create a three-dimensional image of plankton distribution and determine the areas where blue-green and green algae are most abundant in Taganrog Bay and the Azov Sea.
Conclusion. The described mathematical model and mathematical modeling methods have been integrated into a software package. This allows us to simulate and predict all changes that have occurred and will occur in the waters of Taganrog Bay. This, in turn, will undoubtedly contribute to informed decision-making in the future development of the Azov Sea.
Belova Yu.V., Chistyakov A.E. Modeling the Dynamics of Harmful Phytoplankton Species Concentration in Taganrog Bay of the Azov Sea. Safety of Technogenic and Natural Systems. 2025;9(4):284-293. https://doi.org/10.23947/2541-9129-2025-9-4-284-293. EDN: YTBWWQ
Introduction. The excessive growth of harmful phytoplankton is a problem in many water bodies in Russia and around the world. Coastal estuarine systems, such as Taganrog Bay, are particularly vulnerable to this issue due to several factors: high nutrient runoff from rivers, consistent warming due to shallow depths, and differences in depth and salinity. These outbreaks of potentially toxic algae blooms pose a threat to local communities, harm fish populations, and can lead to oxygen depletion and other negative consequences. In Taganrog Bay, microalgae belonging to the cyanophyte are particularly dangerous. Their biomass can reach up to 70% in the summer, and in some cases, it can even reach 90% of total phytoplankton [1].
Cyanophytes are also called cyanobacteria, or less formally blue-green algae. This type of phytoplankton is distinguished from other species by several features that are advantages in their competition for resources, which explains the high proportion of their biomass. First of all, cyanobacteria are prokaryotes and have a very simple cell structure similar to a bacterial one, without a nucleus, mitochondria, Golgi apparatus or endoplasmic reticulum. Individually, cyanophytes are small compared to other algae species, but they often form massive colonies or filaments. The buoyancy of blue-green algae is provided by gas vacuoles, which allow them to change their density, which leads to their movement in the water column in a vertical direction [2]. This mechanism provides better access to either light or nutrients [3], and the presence of nutrients in the reservoir plays a major role in changing its density [4]. All this gives cyanobacteria an advantage over other types of plankton. In addition, turbulent diffusion and the velocity of movement of the aquatic environment in the vertical direction can affect the vertical migration of cyanobacteria [5].
In coastal ecosystems, cyanobacteria have been of interest due to their potential toxicity and their role in the production of phytoplankton. These bacteria release toxins that vary in nature depending on the species, and can be neurotoxic, hepatotoxic, or endotoxic. However, not all blooms of cyanobacteria release toxins. Currently, researchers are studying the nature of these toxins and the conditions that cause their release [6].
Aphanizomenon flos-aquae, Microcystis aeruginosa, and Anabaena spp. are the most common species found in the waters of Taganrog Bay. These species can produce toxins related to hepatotoxins and neurotoxins [7].
Many domestic and foreign researchers have devoted their works to the study of potentially harmful cyanobacterial blooms. In [8], the role of phosphorus in promoting the growth of blue-green algae was investigated. In study [9], the process of vertical movement of cyanobacteria of the Microcystis species was modeled, which allows them to dominate during the bloom period in reservoirs. The effect of the intensity of light radiation and mixing of waters under the action of wind on the development of algae was modeled using the Ansys Fluent and MATLAB systems, which is described in [10]. The authors of research [11] used autoregressive and multidimensional versions of linear regression, random forest, and Long Short-Term Memory (LSTM) neural networks to predict the development of blue-green algae. In [12], a nonstationary three-component mathematical model was proposed to study the competition between two types of phytoplankton (including toxic ones) and their absorption by zooplankton.
The review of modern research conducted by the authors revealed a gap in scientific knowledge, which consists in the lack of an integrated approach linking the authors' model of phytoplankton population dynamics based on convection-diffusion equations with the hydrodynamic model, ignoring the influence of abiotic factors, using one-, two-dimensional models and ready-made software packages that do not provide reliable results for coastal systems. The authors believe that this issue can be addressed by applying an integrated approach to modeling phytoplankton dynamics in the coastal systems of Taganrog Bay. This approach would take into account their important features: significant differences in depth, salinity, complex geometry of the calculated area, increased influx of nutrients, etc.
According to Decree of the Government of the Russian Federation No. 219 dated April 10, 2007, one of the goals of monitoring water bodies is “timely identification and forecasting of the negative effects to water, as well as the development of negative processes affecting water quality in water bodies and their condition, the development and implementation of measures to prevent the negative effects of these processes”1. The development of mathematical modeling methods and the development of software systems based on them make it possible to obtain forecasts of the development of dangerous phenomena in complex natural systems. Such data can be shared with decision makers to monitor and manage the situation in coastal areas. One of the ways to restore Taganrog Bay may be to replace blue-green algae with green ones. It is noted in [13] that in those areas of the reservoir where the number of green algae has increased in relation to blue-green and diatoms, the ability of the water body to self-purify has increased. In [14], the dynamics of microalgae development in drinking water intake sites was studied, the depressing effect of cyanobacteria blooming was noted, and a system for monitoring the dynamics of phytoplankton populations was proposed.
Due to the need to predict the occurrence of harmful “blooms” of microalgae, it is necessary to construct complex mathematical models of phytoplankton population development. These models should take into account advective and diffusive transfers, weather conditions, and geometry of the calculated area, limiting the growth of microalgae by the presence of nutrients, salinity and temperature regimes [15]. The use of mathematical methods proposed in this article is justified because they provide a high level of accuracy in modeling processes occurring in complex natural systems, using a small amount of input data. Additionally, these methods are more cost-effective than conducting expeditionary research.
The aim of this research is to make a medium-term prediction of the development of blue-green algae during the bloom season using mathematical modeling methods. To achieve this, the authors have solved the following tasks:
Materials and Methods. The study was based on a three-dimensional model of the dynamics of phytoplankton populations based on a system of convection-diffusion-reaction equations with nonlinear source functions. The difference approximation of the model was based on explicit-implicit splitting schemes. The authors' method of interpolation of depth values was used to construct a three-dimensional computational domain. It was also used to interpolate salinity and temperature values from cartographic information.
A three-dimensional model of the dynamics of phytoplankton populations was developed based on the work of Sukhinov A.I. and Yakusheva E.V. [16][17]. The model was based on a system of non-steady convection-diffusion-reaction equations:
 (1)
(1)
where qi — concentration of the i-th component, mg/l,  ; V = (u, v, w) — vector of the water flow velocity, m/s; μ = {μ, μ, v} — turbulent exchange coefficients, m²/s;
  — nonlinear function-source of nutrients, mg/(l s); ∇ — gradient; 1 —Aphanizomenon flos-aquae blue-green algae (potentially toxic; 2 —Chlorella Vulgaris green algae (included in the base of the food pyramid); 3 — dissolved organic phosphorus; 4 — suspended organic phosphorus; 5 — phosphates; 6 — nitrates; 7 — nitrites; 8 — ammonia; 9 — dissolved oxygen: it mainly enters the aquatic environment from the surface of a reservoir as a result of mixing (mainly waves caused by wind), is released by aquatic plants during photosynthesis in the presence of light and is consumed during respiration in the absence of light.
The equations describing the transformation cycles of the simulated substances are given in [18].
The growth rate of phytoplankton populations was determined by the availability of nutrients (phosphates, nitrates, nitrites and ammonium), optimal values of temperature, salinity and illumination. Biomass decreased due to excretion and death. Green algae compete with cyanobacteria for resources. The growth rate of phytoplankton populations was expressed as a function of salinity S, temperature T, light intensity I, and a sufficient number of dissolved oxygen molecules in the water. Also, the growth of microalgae depended on the concentration of the main nutrients — nitrogen compounds (nitrates NO3, nitrites NO2, ammonia NH4) and phosphorus (phosphates, dissolved organic phosphorus DOR, suspended organic phosphorus ROP). An initial boundary value problem was set for system (1), and the corresponding initial and boundary conditions were added [18].
The numerical solution to the problem of phytoplankton population dynamics was to transform the input data using mathematical modeling methods. When solving problem (1), the values of the components of the vector of the water flow in the nodes of the computational grid were used as input data. It was calculated based on the model of hydrodynamics [19], values of salinity S0, temperature T0 and concentrations q0i at time t0. For the difference approximation, the modeling area was covered by a computational grid μω ωτ × ωh that was uniform in time and three spatial directions:

 ,
,
where τ — step in time, 0 ≤ t ≤ T; hx, hy, hz — steps in spatial directions; Lx, Ly, Lz — maximum size of the calculated area in space.
Explicit and implicit schemes were used to discretize problem (1):


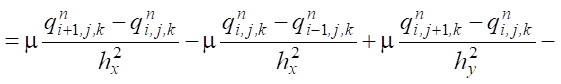
 ,
,
where qn+σ = σ qn+1 + (1 – σ)qn, σ ∈ [0,1] — weight of the scheme.
The result of applying this approach to the approximation of the convection-diffusion-reaction equations led to a series of two-dimensional and one-dimensional problems. Along the Ox and Oy axes, the approximation was done using a symmetric scheme with weights (Crank-Nicolson). Along the Oz axis, an explicit scheme was used, and a run-through method was used for software implementation
The authors' method of interpolating the values of depth, salinity, and temperature was used to construct a uniform space-time grid. Cartographic information was used to define the boundaries of the computing area vertically, for example, pilot charts used for the needs of the shipping and fishing industries. Often, information about the depths of a reservoir was set at certain points or by level isolines and may not be present at the points of the calculated grid. Figure 1 shows the initial relief image of the bottom of the Azov Sea, where the depths were indicated by level isolines.

Fig. 1. Isolines of the depth level of the Azov Sea
Such maps did not have a high degree of smoothness at the points of joining, so the interpolation algorithm was used in this study [20]. In order to construct a function of the bottom topography with a high degree of smoothness, an equation was solved:
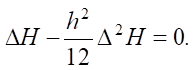 (2)
(2)
The fundamental system of solutions of equation (2) had the form:
 (3)
(3)
The depth values were interpolated based on the splines of function (3).
The algorithm of the program module was as follows: a file in the .txt format was submitted as input, containing an array with depth isolines or points indicating the depths. Then a fourth-order accuracy scheme was constructed for the diffusion transfer operator [20]. The resulting grid equations were solved using an adaptive, modified alternating triangular variational method. The output was a text file containing an array of values of the depths of the Azov Sea.
Results. As a result of the research, the authors obtained a medium-term forecast of the distribution of blue-green and green algae based on an integrated approach using models of phytoplankton population dynamics and hydrodynamics. Figure 2 shows the result of the authors' algorithm, a reconstructed map of the depths of the Azov Sea.
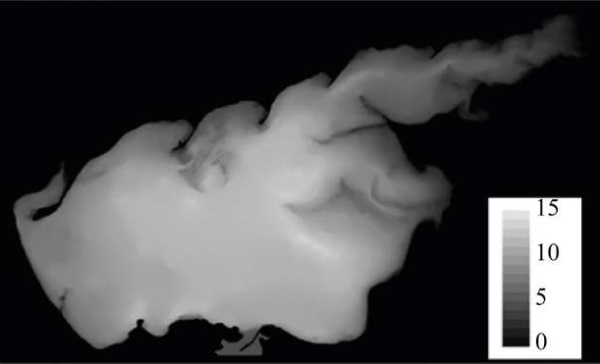
Fig. 2. The resulting image of the bottom topography of the Azov Sea
Based on the developed method, sufficiently smooth distributions of salinity and temperature values suitable for modeling were also obtained, the images of which are shown in Figure 3.


Fig. 3. Application of the interpolation method:
a — initial image of isohaline [21];
b — initial image of isotherms2;
c — resulting image of salinity distribution S, ‰;
d — resulting image of temperature distribution T, °C
The obtained distributions of depths, salinity, and temperature were used as input data for solving problem (1). Figure 4 shows the concentrations of two phytoplankton populations obtained as a result of the computational experiment. Uniform distributions of the simulated substances were input data for the software module, with a time interval of 30 days.

Fig. 4. Results of solving the problem of dynamics of phytoplankton populations:
a — distribution of concentrations of blue-green algae q1, mg/l;
b — distribution of concentrations of green algae q2, mg/l;
c — graph of the dependence of the growth coefficient
of phytoplankton populations on salinity S: 1 — green algae; 2 — blue-green algae
Discussion. The interpolations of the distributions of depths, salinity, and temperature, obtained using the algorithm presented in this paper, have a sufficient degree of smoothness at the points where they are joined. A computational experiment has shown that the range of blue-green algae is wider than that of green algae — they are distributed throughout Taganrog Bay and carried by currents into the main part of the Azov Sea.
The mathematical model of phytoplankton population dynamics takes into account several factors, including the limitation of microalgae growth by nutrients, the influence of the hydrological regime on the growth coefficient, geographical dynamics under the influence of convection and diffusion processes, and the oxygen regime. By combining this model with a hydrodynamic model, it is possible to create three-dimensional images of the distribution of substances being modeled. This allows for the consideration of not only the biological aspects of phytoplankton growth but also the spatio-temporal dynamics of biomass and the shape of the computational area.
Conclusion. The described mathematical model and the proposed methods have been integrated into the Azov3D software package. This allows us to predict the development of hazardous blooms of phytoplankton (eutrophication) under different weather conditions, taking into account changes in salinity, temperature, current patterns, nutrient availability, and oxygen regime. The forecasts generated can be used to develop a strategy for the sustainable management of Taganrog Bay, an important natural area. Various strategies for managing this aquatic ecosystem are currently being developed, as well as safety mechanisms to prevent suffocation and eutrophication events. Mathematical modeling techniques, the development of which is discussed in this article, provide inexpensive and efficient tools for monitoring and predicting the state of aquatic systems.
1. On Approval of the Regulations on the Implementation of State Monitoring of Water Bodies. Decree of the Government of the Russian Federation No. 219 dated April 10, 2007. (In Russ.) URL: https://docs.cntd.ru/document/902037173/titles/6560IO (accessed: 25.11.2025).
2. The ESIMO Operational Module. Water Surface Temperature in the Azov Sea. The Unified State Information System on the Situation in the World Ocean. (In Russ.) URL: http://hmc.meteorf.ru/sea/azov/sst/sst_azov.html (accessed: 25.11.2025).
1. Kovaleva GV. Problem of Water Bloom in the Sea of Azov. In: Proceedings of the Southern Scientific Center of the Russian Academy of Sciences “Modeling and Analysis of Natural Hazards in the Azov Region”. Vol. VIII. Rostov-on-Don: Southern Scientific Center of the Russian Academy of Sciences; 2020. P. 122–148. (In Russ.)
2. Overman C, Wells S. Modeling Cyanobacteria Vertical Migration. Water. 2022;14(6):953. https://doi.org/10.3390/w14060953
3. Gerbersdorf SU, Schubert H. Vertical Migration of Phytoplankton in Coastal Waters with Different UVR Transparency. Environmental Sciences Europe. 2011;23:36. https://doi.org/10.1186/2190-4715-23-36
4. Brookes JD, Ganf GG. Variations in the Buoyancy Response of Microcystis Aeruginosa to Nitrogen, Phosphorus and Light. Journal of Plankton Research. 2001;23(12):1399–1411. https://doi.org/10.1093/plankt/23.12.1399
5. Hongru Zhao, Wei Zhu, Huaimin Chen, Xiaohua Zhou, Ruo-Chen Wang, Ming Li. Numerical Simulation of the Vertical Migration of Microcystis (Cyanobacteria) Colonies Based on Turbulence Drag. Journal of Limnology. 2017;76(1):190–198. https://doi.org/10.4081/jlimnol.2016.1501
6. Chorus I, Welker M (eds.). Toxic Cyanobacteria in Water, 2nd edition. Boca Raton (FL): CRC Press; 2021. 858 p.
7. Matishov GG, Fushtei TV. On the Problem of Harmful Algal Blooms in the Waters of Sea of Azov. Electronic Journal “Researched in Russia”. 2003;(6):213–225. (In Russ.)
8. Man Xiao, Burford MA, Wood SA, Aubriot L, Ibelings BW, Prentice MJ, et al. Schindler's Legacy: From Eutrophic Lakes to the Phosphorus Utilization Strategies of Cyanobacteria. FEMS Microbiology Reviews. 2022;46(6):fuac029. https://doi.org/10.1093/femsre/fuac029
9. Wei Zhu, Ganyu Feng, Huaimin Chen, Ruochen Wang, Yongqin Tan, Hongru Zhao. Modelling the Vertical Migration of Different-Sized Microcystis Colonies: Coupling Turbulent Mixing and Buoyancy Regulation. Environmental Science and Pollution Research. 2018;25(30):30339–30347. https://doi.org/10.1007/s11356-018-3041-8
10. Zongpu Xue, Wei Zhu, Yuyang Zhu, Xihui Fan, Huaimin Chen & Ganyu Feng. Influence of Wind and Light on the Floating and Sinking Process of Microcystis. Scientific Reports. 2022;12:5655. https://doi.org/10.1038/s41598-022-08977-5
11. Fournier C, Fernandez-Fernandez R, Cirés S, López-Orozco JA, Besada-Portas E, Quesada A. LSTM Networks Provide Efficient Cyanobacterial Blooms Forecasting Even with Incomplete Spatio-Temporal Data. Water Research. 2024;267:122553. https://doi.org/10.1016/j.watres.2024.122553
12. Neverova G, Zhdanova O. Mathematical Modeling of the Evolutionary Dynamics of a Planktonic Community Using a Discrete-Time Model. Mathematics. 2023;11(22):4673. https://doi.org/10.3390/math11224673
13. Kang Peng, Zhixiong Hu, Rui Pang, Mingyue Li, Li Liu. Spatiotemporal Dynamics and Driving Factors of Phytoplankton Community Structure in the Liaoning Section of the Liao River Basin in 2010, 2015, and 2020. Water. 2025;17(15):2182. https://doi.org/10.3390/w17152182
14. Bo Li, Jing Li, Yuehang Hu, Shaozhe Cheng, Shouchun Li, Xuezhi Zhang. Algal Community Dynamics in Three Water Intakes of Poyang Lake: Implications for Drinking Water Safety and Management Strategies. Water. 2025;17(13):2034. https://doi.org/10.3390/w17132034.
15. Kudinov NV, Filina AA, Nikitina AV, Bondarenko DV, Razveeva IF. Simulation of Vertical Movements of Seawater in Stratified Reservoirs. Advanced Engineering Research (Rostov-on-Don). 2023;23(2):212–224. https://doi.org/10.23947/2687-1653-2023-23-2-212-224
16. Novikov M, Pakhomova S, Berezina A, Yakushev E. Model-Based Analysis of the Oxygen Budget in the Black Sea Water Column. Water. 2024;16(17):2380. https://doi.org/10.3390/w16172380
17. Yakushev EV, Pollehne F, Jost G, Kuznetsov I, Schneider B, Umlauf L. Analysis of the Water Column Oxic/Anoxic Interface in the Black and Baltic Seas with a Numerical Model. Marine Chemistry. 2007;107:388-410. https://doi.org/10.1016/j.marchem.2007.06.003
18. Sukhinov AI, Chistyakov AE, Belova YuV, Kuznetsova IYu. Analytical and Numerical Study of the Problem of Plankton Population Dynamics in the Presence of Microplastics. Matematicheskoe Modelirovanie. 2024;36(3):95–114. (In Russ.) https://doi.org/10.20948/mm-2024-03-07
19. Sukhinov AI, Kuznetsova IYu. Mathematical Model of Three-Component Suspension Transport. Computational Mathematics and Information Technologies. 2023;7(3):39–48. (In Russ.) https://doi.org/10.23947/2587-8999-2023-7-3-39-48
20. Chistyakov AE, Semenyakina AA. Use of Interpolation Methods for Recovery Bottom Surface. Izvestiya SFedU. Engineering Sciences. 2013;4(141):21–28. (In Russ.)
21. Matishov GG, Berdnikov SV, Zhichkin AP, Makarevich PR, Dzhenyuk SL, Kulygin VV, et al. Atlas of Climatic Changes in Large Marine Ecosystems of the Northern Hemisphere (1878-2013). Rostov-on-Don: Southern Scientific Center of the Russian Academy of Sciences; 2014. 256 p. (In Russ.)
Yulia V. Belova, Cand. Sci. (Phys.-Math.), Associate Professor of the Department of Mathematics and Computer Science
ElibraryID: 822411
ScopusID: 57196457293
ResearcherID: L-7893-2016
1, Gagarin Sq., Rostov-on-Don, 344003
Aleksandr E. Chistyakov, Dr. Sci. (Phys.-Math.), Professor of the Department of Mathematics and Computer Science
ElibraryID: 474527
ResearcherID: O-1507-2016
1, Gagarin Sq., Rostov-on-Don, 344003
Mathematical prediction of algae growth in the bay has been performed. A three-dimensional model of the dynamics of harmful phytoplankton species has been developed. Taking into account depth, salinity, and temperature has improved the accuracy of the description of the environment. Interpolation methods have yielded smooth fields of depth, salinity, and temperature. Three-dimensional maps of the distribution of cyanobacteria and green algae have been obtained. The results are useful for planning water protection and coastal zone management.
Belova Yu.V., Chistyakov A.E. Modeling the Dynamics of Harmful Phytoplankton Species Concentration in Taganrog Bay of the Azov Sea. Safety of Technogenic and Natural Systems. 2025;9(4):284-293. https://doi.org/10.23947/2541-9129-2025-9-4-284-293. EDN: YTBWWQ


Safety of Technogenic and Natural Systems
eISSN 2541-9129
Contact with: Publisher / Editorial Office of the Journal
Publisher: Don State Technical University - DSTU, Rostov-on-Don, Russia - https://donstu.ru/en/
Editor-in-Chief: Meskhi Besarion Chokhoevich, Doctor of Technical Sciences, Professor (Rostov-on-Don, Russia)
Don State Technical University
1, Gagarin Sq., Rostov-on-Don, 344003, Russia
tel.: +7 (863) 2738-372, e-mail: btps@donstu.ru
1, Gagarin Square, Rostov-on-Don, 344003, Russian Federation, Don State Technical University
Processing of personal data


