TECHNOSPHERE SAFETY
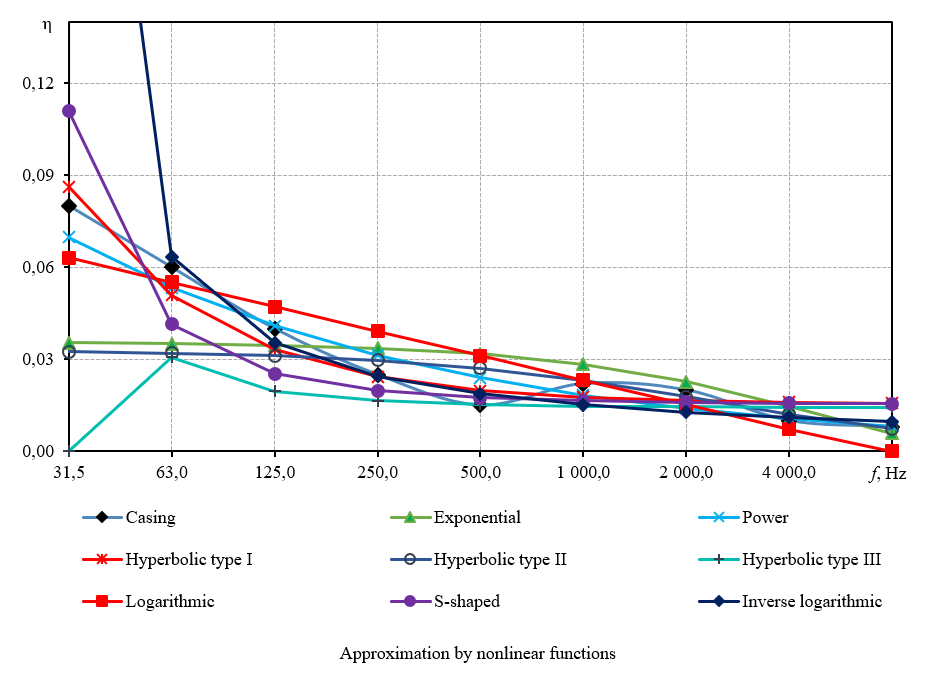
The losses of vibrational energy in multi-purpose machine units are investigated. Measurements were taken in octave frequency bands, both on the bench and on the machine. It was found that losses in cast-iron housings were weakly dependent on frequency. Accurate regression loss models for different cutting operations were obtained. These models allow predicting vibration and adjusting damping. The results can be used to reduce noise and protect operators' health.
Introduction. Vibration in multi-purpose drilling-milling-boring machines affects equipment reliability, production noise levels, and operator safety. Literature discusses sources of vibration, damping mechanisms, and methods for measuring vibration characteristics, while regulatory documents establish permissible levels of vibration acceleration and vibration velocity. However, the frequency dependencies of vibration energy loss factors for individual machine components, which are necessary for engineering vibration forecasting, remain insufficiently studied. The aim of this research is to evaluate vibration energy loss factors in the components of multi-purpose drilling-milling-boring machines and analyze their effect on the level of vibration affecting the operator, thereby substantiating measures to improve occupational safety. The objectives included conducting octave-band measurements, performing regression analysis of the data, and selecting relationships with the lowest standard deviation.
Materials and Methods. This study utilized an integrated approach combining experimental measurements and mathematical data processing methods. Experiments were conducted on a dedicated test bench and directly on the machine using a torque hammer to excite vibrations. Vibration acceleration was recorded in octave frequency bands using modern measuring equipment. Vibrational energy loss coefficients (η) were calculated using a modified formula that took into account vibration acceleration levels. To summarize the experimental data and construct predictive models, regression analysis was used, including approximation by nonlinear functions and polynomials of varying degrees. The quality of the approximation was assessed using the minimum standard deviation criterion.
Results. It was experimentally established that the loss coefficients for cast iron housing parts in the frequency range from 125 to 8000 Hz varied within the range of (7.8–8.8) ·10–3, demonstrating a weak frequency dependence. For engineering calculations, constant value of η ≈ 8·10–3 could be adopted. Regression analysis revealed that the best approximating relationship for the gearbox housing was a sixth-order polynomial. Specific relationships were obtained for the cutting units: for boring and drilling, the best fit was provided by a seventh-order polynomial, and for the milling unit, by a fifth-order polynomial. The resulting mathematical models accurately described the behavior of loss coefficients within the studied frequency range.
Discussion. The analysis of the results confirmed that the dissipative properties of machine structural elements were not constant and depended significantly on the type of technological operation and frequency range. The identified analytical relationships allowed us to move from point estimates at fixed frequencies to continuous energy loss prediction, which was critical for analyzing the dynamic behavior of the machine at its natural frequencies. This opens up opportunities for targeted design. Knowing the frequency spectrum of the most hazardous vibration modes, we can optimize damping specifically in these areas. For example, we can select materials with increased internal friction, or use composite vibration-absorbing coatings in specific structural areas.
Conclusion. This study provides tools for quantitative assessment of vibrational energy loss coefficients for the main vibration sources in multi-purpose machine tools. The potential practical significance of this work lies in the possibility of using the derived regression relationships to develop active and passive vibration control algorithms, design damping systems, and select materials. Implementation of these findings will reduce noise and vibration levels in work areas, minimize the risk of occupational illnesses for operators, and improve overall occupational safety. Additionally, it will extend equipment life by reducing the vibration loads on components. The practical significance of this work lies in its potential for use in developing vibration control algorithms, which will significantly reduce noise levels in work areas.

The differences between greenhouse gas-emitting countries have been studied using a number of indicators. For the first time, a typology of countries based on complex clustering has been constructed. Four groups of states with similar decarbonization conditions have been identified. It was shown that the amount of emissions did not determine the choice of climate strategy. Each group has its own priorities for emission reduction. The results can used to develop and adapt climate strategies.
Introduction. The relevance of this work stems from the need to move away from general decarbonization plans and towards differentiated climate strategies, since countries that emit greenhouse gases (GHGs) differ in terms of their energy balance, level of industrialization, population size, carbon intensity of their economy, and the export of fuel and energy resources. The same emission reduction goals may require different technological, investment, and regulatory solutions. Unification approaches are not effective in this context. The literature mainly focuses on analyzing carbon intensity, low-carbon development scenarios, and individual energy indicators. The fragmentary nature of the known approaches prevents the creation of a typology of GHG-emitting countries based on a combination of economic, demographic, energy, and climatic characteristics. The presented scientific work fills this gap. The aim of this study was to form and interpret the typology of key GHG-emitting countries based on a comprehensive analysis of economic, demographic, energy, and climatic indicators. According to this typology, decarbonization conditions and transitional climate risks within clusters were identified.
Materials and Methods. The research was based on a statistical database for more than 40 GHG-emitting countries. To ensure comparability, data preprocessing, z-score normalization of features, clustering by Ward’s hierarchical method, and the combined t-SNE1 + k-means2 approach were used. The optimal number of clusters was determined using the elbow method and the silhouette coefficient, and the clustering quality was determined by the Davies–Bouldin index.
Results. Significant cross-country differences in specific greenhouse gas emissions per capita, the carbon intensity of GDP at PPP3, the structure of generation capacity, and specific emissions per unit of electricity produced have been identified. Based on the results of hierarchical clustering and t-SNE + k-means, four groups of states were identified:
- two largest emitters with large-scale and diversified energy production;
- four exporters of fuel and energy resources;
- eight carbon-intensive industrial and developing countries;
- 31 relatively energy-efficient and low-carbon economies.
Discussion. Cluster analysis suggested that the absolute amount of GHGs emissions was not the only factor to consider when choosing a climate strategy. Countries with similar carbon footprints could differ significantly in terms of economic scale, the proportion of coal generation, export orientation of the energy complex, industrialization level, energy efficiency, and final energy consumption structure. Each formed cluster required different priorities and approaches for adapting decarbonization strategies, namely: reduction of coal generation and modernization of networks for the largest emitters; reduction of emissions in mining and processing; CCUS4 and export diversification for resource economies; improvement of industrial energy efficiency and modernization of generation for industrial countries; elimination of residual emissions and accounting for imported carbon footprint for low-carbon economies. The limitations of the study were related to differences in national statistical reporting, incompleteness of some indicators, and sensitivity of clustering to the choice of variables.
Conclusion. The proposed cluster approach makes it possible to move from ranking countries based on emissions to identifying groups with similar profiles of economic, demographic, energy, and climate indicators. The results of clustering can be used in further analysis of key emitting countries to identify the most suitable technologies and legislative measures for reducing greenhouse gas emissions. Additionally, the results can be used to assess the effectiveness of implementing and adapting decarbonization strategies.

A method for remote inspection of crane runways at height has been proposed. An unmanned vehicle equipped with cameras and a laser scanner inspects the paths nearby. A trained neural network automatically detects defects in rails and supports. A three-dimensional model allows for accurate measurement of defects with millimeter precision. This method doubles the inspection speed and eliminates the need for specialists to climb to heights. The results of this method can be applied in workshops and warehouses to assess crane safety.
Introduction. Inspecting the overhead crane runways in production workshops and warehouses is a challenging and dangerous task. The risks for specialists are associated with the high altitude at which the runways are located and the lack of walkways along them. At the same time, standard visual and dimensional inspection is characterized by a low inspection speed. The scientific literature contains numerous studies on the potential of artificial intelligence (AI) to ensure occupational safety: methods for monitoring occupational risks and preventing accidents, the relationship between accident rates and the competencies of crane operators, the detection of defects in removable load‑handling devices using computer vision tools, as well as remote monitoring of crane safety based on video data from IP cameras. However, these solutions do not address the inspection of crane runways, which have specific features, primarily their considerable length (often up to 200 meters or more). The application of AI requires video-analytical monitoring along the entire length of the runway and training a neural network to recognize local defects and geometric deviations, which existing methods do not provide. Today, crane runway inspection is conducted through visual and dimensional control methods, including direct inspection and surveying using total stations and theodolites. While these methods are accurate, they are labor-intensive and time-consuming. Therefore, there is a need for the use of AI to improve safety and speed while maintaining accuracy in identifying faults in crane runways. The aim of this research is to develop a method for remote inspection of the overhead crane runways located at height in industrial facilities. This will help minimize the exposure of workers to hazardous and harmful working conditions while maintaining accuracy, speed, and reliability of the inspection results.
Materials and Methods. Data on crane runway defects collected during inspections at industrial facilities was used as the basis for the study. The methodology for identifying defects in crane runways was based on GOST R 56944–20161. Computer vision neural networks were trained using open libraries for Python language. A modernized pre-trained YOLOv8 neural network was used to detect defects.
Results. A method for remote detection of defects on overhead crane runways was developed using an unmanned aerial vehicle designed by the authors (a quadcopter with a protective frame, equipped with a Livox MID‑40 lidar, an Orbbec Gemini 2 depth camera, a 4K RGB camera, and a DWM1000 positioning system supporting TWR and TDOA). Based on survey data collected in 2024 from 352 overhead cranes with a total runway length of approximately 14 kilometers, a modernized YOLOv8 neural network for computer vision was trained. This resulted in the creation of a complete three-dimensional point cloud that covered the runways, crane beams and supports, as well as reference to column lines and centers. The three-dimensional model allowed for the automatic identification and classification of local defects, as well as the estimation of their sizes with accuracy of one millimeter. Automated geometry assessment showed that the deviations in the runway markings in the model in question did not exceed the permitted values according to GOST R 56944–2016 (40 millimeters in one section and 10 millimeters on adjacent columns), which confirmed the effectiveness of the method.
Discussion. The results obtained indicate that the authors’ goal has been achieved — the development of a method for remote inspection of overhead crane runways. This was made possible by conducting a significant number of surveys, which provided a diverse range of defects for training neural networks. A comparison with previous studies has shown the uniqueness of the proposed approach to inspecting overhead crane runways. Methods based on artificial intelligence and unmanned aerial vehicles (UAVs) have previously been used to monitor personnel, assess removable lifting attachments, and inspect tower cranes outdoors. However, these methods were not suitable for detecting local defects in overhead crane runways inside production facilities. The main limitation of the developed method was the flight time of the UAV (no more than 20 minutes), which was due to the low battery capacity. This capacity could not be increased without increasing the maximum size of the device (0.5 meters) in the confined conditions of enclosed spaces. The new method's results were positive, as it enabled inspection of tracks along their entire length from a close distance. By building a 3D model using photogrammetry, it was possible to assess the size of defects and reduce labor intensity and duration of the survey by at least half. These benefits made its further development and practical implementation worthwhile.
Conclusion. The main outcome of the study was the development of a method for remote inspection of overhead crane runways located at height in industrial facilities. During the research, neural networks were trained to detect defects, and an algorithm was created for inspection. This involved creating a three-dimensional model that allowed for automated assessment of geometric deviations in the runways in both longitudinal and transverse planes, as well as the identification of local defects. The key benefit of this method was that it eliminated the need for experts to climb to heights, ensuring their safety. Additionally, it allowed for the inspection of hard-to-reach areas and the detection of previously invisible defects, reducing the likelihood of future emergency situations. Further research in this field will focus on improving the system's ability to automatically identify the condition of load-bearing metal structures and possible defects in cranes.

The protection of courtyard recreation areas from urban vehicle noise is considered. For the first time, the use of small architectural forms was proposed as a means of noise protection. A gazebo, acoustic screens, and green spaces were compared by calculation. It was found that a solid wall of the gazebo provided high isolation of air noise. In terms of efficiency, a gazebo is comparable to a standard noise shield. These results can be applied to yard improvement and acoustic housing design.
Introduction. The new “Infrastructure for Life” project aims to renovate housing, public spaces, and develop convenient public transportation routes. Along with chemical air pollution, motor vehicle traffic is becoming a significant source of noise pollution that threatens public health. Special acoustic barriers and green spaces are used to control noise. However, existing methods of noise protection for courtyard spaces are not always effective and/or require significant material costs. To overcome these limitations, the use of small architectural forms (SAFs) has been proposed. These forms can serve as noise reduction measures and also be elements of landscaping. The aim of this research is to provide a calculated justification for the possibility of using engineering and technical landscaping elements, namely SAFs, to reduce the noise from adjacent residential infrastructure, particularly motor vehicles, on recreational and leisure areas in residential districts.
Materials and Methods. The empirical basis of the study consisted of data from regulatory documents, scientific publications, and field observations. The research object was a small architectural form, a semi-enclosed gazebo with a solid rear wall, which could be used for noise protection of adjacent courtyard spaces and landscaped areas. For comparison, we also considered the following design solutions: no barrier, a standard noise barrier, a strip of green space, and a small railway barrier. Acoustic calculations were performed in accordance with current standards using specialized software, including Ecolog-Noise, Calculation of Sound Insulation, and Calculation of Traffic Flow Noise.
Results. Calculations of noise impact and airborne sound insulation were performed for various design options, and the results were presented in tables and graphical materials. The frequency characteristic of airborne sound insulation for a solid SAF wall was determined graphically in the form of a broken line. The airborne sound insulation index for the rear wall of the SAF was 29 dB, which indicated its potential use as a local noise protection element under the considered calculation conditions. Calculations of traffic noise characteristics showed that the equivalent sound level of the motor traffic flow was 59.7 dBA, while the maximum permissible level for a residential recreation area was 45 dBA. The graphical representation of the noise propagation calculation results was presented as isolines of acoustic discomfort zones at the normalization height of 1.5 m. Additionally, a 3D graphical distribution of noise was prepared for visualization purposes.
Discussion. The results showed that the calculated noise reduction was primarily determined by the presence of a solid enclosing surface between the acoustic impact source and the protected area. In the conditions considered, a standard noise-proof screen and a gazebo-type SAF proved to be the most effective, while green spaces, a small acoustic screen and the absence of any protective measures did not provide the required level of noise protection.
Conclusions. The use of enclosing structures, including acoustic barriers and SAFs, can significantly reduce the noise level and decrease the acoustic discomfort zone. The need to develop affordable and effective solutions for reducing noise levels in residential areas is determined by sanitary and hygienic legislation. The calculated data demonstrate the prospects of using semi-enclosed SAFs with solid enclosing elements as an additional means of local noise protection. However, the final assessment of their effectiveness requires further verification for other structural solutions, planning conditions, and noise load scenarios.
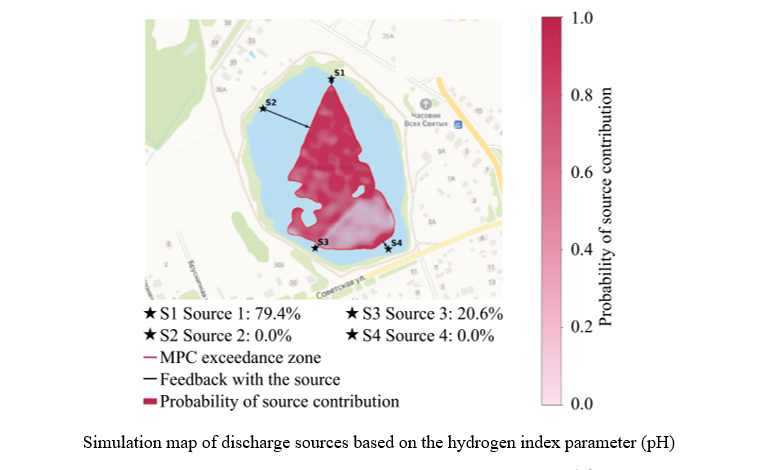
A new approach to finding the source of water pollution is proposed. This approach combines computer vision with hydrodynamic transfer modeling. A neural network identifies boundaries of the water area from images, while the model searches for the source. The inverse problem is solved by iterating through virtual points along the shore of the reservoir. In computational experiments, the source was correctly identified in ninety-five percent of cases. The results can be applied in environmental monitoring and digital twins of reservoirs.
Introduction. Traditional water body monitoring systems often demonstrate insufficient effectiveness in promptly locating the source of an emergency or non-stationary discharge, which hinders timely management decisions. This problem is further exacerbated by the rapid spread of pollutants in conditions where observational data is incomplete, delayed, or fragmented. These circumstances emphasize the need for methods that can not only detect pollution but also reconstruct the coordinates of its source based on its concentration field. The literature provides a wide range of approaches based on advection-diffusion equations, numerical hydrodynamic modeling, and satellite data analysis. However, the integration of computer vision methods with hydrodynamic models to solve the inverse problem of source identification remains under-researched. Theoretically, such integration is justified by the possibility of automated delineation of water area boundaries through semantic segmentation and a physically meaningful description of passive impurities transport. However, there is a scientific gap due to the lack of verified computational schemes that combine these two approaches. The aim of this study is to develop and verify an approach that integrates computer vision and hydrodynamic modeling to accurately identify the source of a negative impact.
Materials and Methods. The methodology included two interconnected modules. The first computer vision module performed semantic segmentation of satellite images or aerial photography data using convolutional neural networks. The result was a binary mask of the water area; its external contours were extracted using OpenCV with morphological post‑processing. The second module implemented a two-dimensional numerical advection-diffusion model based on the finite volume method with a steady velocity field. The inverse identification algorithm generated a set of virtual candidate points along the perimeter of the water body. For each point, a direct calculation of the concentration field was performed, after which a candidate was selected using the root-mean-square error, ensuring the best fit to the observed distribution. Validation was carried out on three synthetic scenarios (pH, dissolved oxygen, free chlorine) in 300 computational experiments.
Results. Three hundred computational experiments were conducted using randomly assigned source coordinates. The computer vision module accurately generated a water area mask in all trials. The inverse identification algorithm, which iterated through candidates in 50-meter increments, identified the true source with absolute accuracy in 285 cases (95%). It was found that 12 out of 15 erroneous cases were due to the source being located less than 1 m from the water area boundary, where the influence of turbulent diffusion and boundary conditions led to the “blurring” of the pollution trace. The key limitations of the method were identified: errors in the two-dimensional hydrodynamic approximation for stratified water bodies, and a decrease in accuracy under sharply non-stationary hydrodynamics. Visualization of the results confirmed the high quality of spatial localization of the source.
Discussion. The results obtained confirmed that the integration of these methods created a synergistic effect. Computer vision ensured the speed and objectivity of spatial data processing, while hydrodynamic modeling provided physical and mathematical validity for the analysis. This approach overcame the key limitation of traditional monitoring by allowing us not only to detect pollution, but also to determine its causes. This is consistent with current trends in predictive analytics.
Conclusion. The developed concept forms the foundation for creating decision-support operational systems and “digital twins” of water bodies. Its implementation in environmental monitoring practices creates the prerequisites for transitioning from reactive response to proactive risk management, and can contribute to enhancing the validity and effectiveness of measures to ensure environmental safety of water resources. Prospects for further research lie in adapting methods for working with real-time online monitoring data and different types of water bodies.
For the first time, the radiation levels of smartphones have been measured during video communication. The study has found that radiation is higher during video calls compared to normal conversations. Unstable connections can double the average radiation level. Moving the smartphone by fifteen centimeters away can significantly reduce the impact. Wireless networks also reduced radiation in the models studied. These results can be used to develop guidelines for safe video communication.
Introduction. The 2020s have brought the issue of electromagnetic radiation (EMR) in video conferencing (VC) to the forefront. Such services have become widespread due to pandemic‑related self‑isolation, falling smartphone prices, and the increased mobility of students and workers. Human tissues heat up locally during conversations and video calls because the device emits non‑ionizing electromagnetic radio waves. Their effect on the body has been described in several studies, but only the situation of audio calls is considered. There is no data on how harmful EMR is in VC. Accordingly, it is impossible to substantiate recommendations for video communication safety, in particular for “protection by distance”. This study aims to fill this gap by determining the level of EMR emitted by smartphones during video conferences.
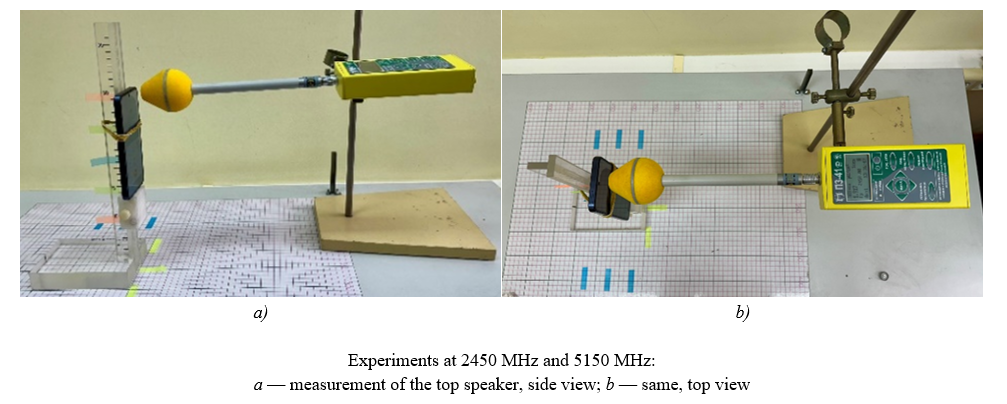
Materials and Methods. The radiation was measured using a PZ‑41 device. The manufacturer was Special Design Bureau PiTON, located in Nizhny Novgorod. The antenna recorded the maximum and average values of the energy flux density (EFD). Conditions: EFD — 0.26–100,000 µW/cm2, frequency used to determine EFD — 2450 MHz, and the averaging time for the parameter before it was displayed on the screen — 1 minute. Smartphones with iOS and Android operating systems with and without Wi‑Fi were tested. Measurements were taken at distances of 0 and 15 cm from the top and bottom speakers. Five experiments were conducted in each case.
Results. During video calls, EMR was higher than during a conversation. For each device, the maximum and average values of EFD in the video call mode with Wi‑Fi enabled and disabled were summarized in tables. We obtained 40 indicators for each of the four cases (two devices and two modes), with minimum and maximum values: 0.365 and 9.732; 3.813 and 72.136; 0.01 and 0.633; 0.781 and 30.271. We noted the data with interference modeling and poor Internet connection. For each experiment, we derived average values. EFD from iOS turned out to be higher than from Android. EFDavg excess with Wi-Fi was indistinguishable (0.6) in 0 cm from the top speaker and more than 85 in 15 cm from the bottom one. The absolute values were low: 0.549 and 0.985 and 0.854 and 0.010, respectively.
Discussion. Protection by distance worked at a distance of 15 cm from the speaker with Wi‑Fi (similar EFDmax and EFDavg values were obtained). Interference both reduced and increased EFD. There was no pattern. Unstable Internet doubled the average EFD. Wi‑Fi reduced the EFD by a factor of 3.1–26.9 for iOS and by a factor of 3.8–167.5 for Android (due to the router’s short range, the smartphone did not need a powerful transmitter). For iOS, high EFDs were recorded at the bottom speaker; for Android — at the top one. Android demonstrated the maximum reduction in EFDavg: with Wi‑Fi 15 cm away from the bottom speaker, the value decreased by a factor of 115; at the top speaker, by a factor of 167.
Conclusion. Device holders distance the smartphone from the user and enhance the VC safety. A failure in Internet connection increases radiation. In the future, it would be advisable to study other smartphone models and work out the regulation of EMF during calls.

A mobile module for the production of composite sorbent at the site of an accident is proposed. For the first time, a stationary production process has been transferred to a vehicle. The full production cycle of a batch of sorbent takes from four to five hours. The weight of the module is 78 kilograms and it is placed on a platform of an off-road vehicle. The sorbent is reusable, which reduces waste. This solution accelerates the removal of oil spills from hard-to-reach areas.
Introduction. Thousands of oil spills are recorded in Russia every year, many of which occur in remote regions such as Western Siberia, the Arctic zone, and the Far East. Oil production at all stages has a negative impact on the lithosphere, hydrological regime, and biodiversity. This impact increases with the scale of petrochemical and mining activities. An analysis of the literature shows that various sorbents and mobile solutions are used to eliminate spills, but there are still challenges with high transportation costs, limited shelf life, difficulty in selecting the right material for a specific type of contamination, and a lack of technological modules that can be delivered to hard-to-reach areas. The aim of this research was to transfer the previously developed technology for producing a composite sorbent to a mobile vehicle, and to determine the design and technical parameters of a mobile technological module (MTM) for the prompt elimination of oil spills.
Materials and Methods. The study was based on a stationary scheme previously developed by the authors for producing a composite sorbent from dichloroethane, cetylamine surfactant, vermiculite, and shredded polystyrene foam. The process involved converting polystyrene foam to a viscous state with a solvent, adding mineral filler, and drying the mixture. To design a mobile technological module, we calculated the production cycle time, the weight of the complex, and the area occupied by the equipment. The calculations took into account elements made of PTFE-4 fluoroplastic according to TU 6-05-810-88[2] , a BYD NYP-3.6 gear pump, a Greenworks G24HG 24V heat gun, a capacitor, containers, mixers, a drying chamber, chutes, and hydraulic fittings. UAZ 23632 was chosen as a mobile vehicle because of its off-road capabilities, cargo capacity, and cargo platform dimensions.
Results. It was established that the composite sorbent could be produced in mobile conditions using a previously developed technological process, which included dissolving polystyrene foam, adding a filler, and drying the formed mass. The production cycle for a batch of 20 sorbent sheets measuring 210×297×5 mm took five hours when drying at a temperature of 22°C, and was reduced to four hours by using a heat gun. The total mass of the main elements of the mobile complex, excluding the sorbent components, amounted to 70 kg, and the working mass of the module with precursors reached 78 kg. The area occupied by the main equipment elements was 8900 cm[2] , which corresponded to the area of a EUR-pallet (approximately 0.9 m[2] ). The calculations confirmed that it was possible to place all components of the mobile technological module on a UAZ 23632 vehicle. During the study, it was also taken into account that the mineral filler could be reused for up to three cycles, after which the loss of sorption properties amounted to 35%.
Discussion. The research results demonstrated that converting the stationary production process for a composite sorbent into a mobile format was technically feasible and met the goal of providing a rapid response to emergency oil spills in hard‑to‑reach areas. Unlike solutions focused on delivering ready‑made sorbents, the proposed approach involved transporting the components and producing the material directly near the spill site, which reduced the dependence on logistics and storage conditions. The comparison with literature data confirmed the relevance of this approach. Mobile technologies made it possible to customize the properties of the sorbent, reducing transportation costs and minimizing waste through material recovery. However, the limitations of this study included its design-based nature: the functionality of the module was assessed based on mathematical modeling and comparison with similar equipment. The practical significance of the results was that they confirmed the possibility of installing a compact production complex on an off-the-road vehicle without changing the basic process flow.
Conclusion. During the study, the key parameters of the mobile technological module were calculated: duration of the production cycle, weight of the equipment, and the occupied area. It has been shown that a module weighing 78 kg and with an area of approximately 0.9 m[2] can be mounted on a UAZ 23632 vehicle and used to produce a composite sorbent directly at the site of an emergency spill. This solution makes it possible to increase the efficiency of pollution cleanup, reduce logistics costs, and lower the environmental impact by reducing the number of transport trips and the amount of recycled polystyrene foam waste. A mobile technological module can be recommended as a component of equipment for eliminating emergency oil spills in hard‑to‑reach areas.
CHEMICAL TECHNOLOGIES, MATERIALS SCIENCES, METALLURGY

The ballistic resistance of steel with a layered internal structure was studied. A composite of ferrite and martensite was obtained by quenching at intercritical temperatures. For the first time, the geometric parameters of the layers influencing bullet resistance have been determined. The critical length of the reinforcing layer that could inhibit the crack was calculated. If the boundaries of the layers were longer than the critical value, they prevented the destruction of the material. These results can be used to develop armor protection and select rolling modes.
Introduction. Increasing the ballistic resistance of armor materials is a pressing scientific and technical challenge driven by the need to develop protective materials that can effectively resist high-speed impacts. Homogeneous isotropic steels, which provide protection through a combination of hardness and toughness, have limited effectiveness under high-speed stress of approximately 103 m/s. These materials typically undergo brittle fracture or complete penetration without significant energy dissipation. A promising alternative approach is the use of heterogeneous and anisotropic materials with a more complex, organized structure that can alter crack propagation trajectories and increase fracture energy intensity. Natural ferrite-martensitic composites (NFMCs), formed in steels quenched from the intercritical temperature range, are an example of such materials. NFMC steels, produced by quenching from the intercritical temperature range, are currently being actively researched. It has been shown that changing the quenching temperature affects the volume ratio of ductile ferrite and high-strength martensite layers, which in turn influences the mechanical properties of the material. However, existing studies have been conducted primarily under static tension or bending conditions. When subjected to ballistic loading with extremely high strain rates, the mechanisms of crack arrest may differ significantly. In this context, the geometric parameters of the structure such as the orientation, length, and thickness of the layers, as well as their ratios, become more important than the strength properties of individual phases. Currently, there is a lack of systematic data on which specific structural characteristics of NFMC are crucial for ballistic resistance, and what optimal values should be. Therefore, the aim of this research is to determine the geometric parameters of NFMC steel structures that ensure effective use in armor protection systems.
Materials and Methods. The study was conducted on 14G2 steel samples measuring 140×70×7 mm. The NFMC structure was obtained by quenching the steel from the intercritical temperature range with an initial banded ferrite-pearlite structure. Bullet resistance tests were performed by shooting targets of this material at a distance of 50 m from a Dragunov sniper rifle with 7.62 mm cartridges with a heat-strengthened core at a bullet velocity of approximately 103 m/s. The geometric parameters of the structure were assessed using a metallographic method on a Neophot 21 microscope using ToupView software to obtain a quantitative assessment.
Results. The microstructure of the studied natural ferritic-martensitic composite, which was a composite material with reinforcing fibers of discrete length, was shown. The results of determining the characteristic parameters of the steel composite geometry in accordance with GOST R 54 570–2011 were presented. The misorientation angle in the structure was 7÷11°. The volume fraction of martensite was 28.37% when quenched from a temperature of 735℃. The average width of the plates of the strengthening phase h̅ = 0.0051 mm and the average free path λ̅⊥ corresponding to the width of ferrite plates с̅ = 0.0131 mm were measured. The ratio c/h was 2.57. The calculated critical length of the martensite layer in NFMC from the condition of equilibrium of normal and shear stresses in it, in NFMC with a total rolling reduction of 70% was 18.3 μm. The data on the distribution of the size of martensite layers in 14G2 steel with the NFMC structure were shown.
Discussion. The obtained data on geometric parameters of the structure of 14G2 steel, quenched from the intercritical temperature range (735℃) and having NFMC organization, meet the requirements for the composite material. In a layered composite with optimal geometry, as a crack propagates successively from one layer to another along the interface and the crack tip approaches it, delamination can form, hindering the initial crack's propagation. Existing ferrite-martensite interfaces with a length greater than the critical value act as an effective barrier to crack propagation.
Conclusion. It was found that high ballistic resistance of the natural ferrite-martensite composite was achieved with an optimal combination of geometric parameters of the composite material structure. At the same time, achieving such an NFMC optimum as armor protection can be ensured by the correct hot rolling technology (total reduction of 70% and higher) and choosing the optimal quenching temperature in the intercritical range.